Selling the Retrace in EUR/GBP at the 100 SMA
EUR/GBP has formed a bearish reversing chart setup on the H1 chart
EUR/GBP was trading on a bearish trend in Q4 of last year and in the first couple of months of 2020. But, we saw a bullish reversal in March and a 12 cent surge from below 0.83 to 0.95, as Euro traders got a boost from the EU, throwing cash at the markets witht the EU covid recovery plan, which is expected to help boost European economies.
We did see a pullback in April, but since May this pair has been following a bullish trend, which seemed more like a normal trend, rather than the surge we saw in March. Although, August has been bearish for EUR/GBP, as it has been retracing lower on the daily chart.
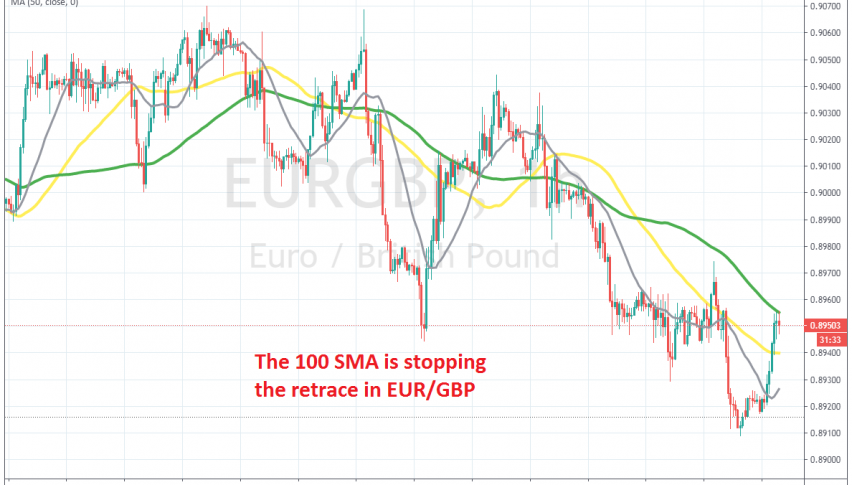
But, we have been seeing a pullback higher during the European session, with EUR/GBP climbing around 50 pips higher today. But, moving averages are providing resistance at the top right now, so we decided to open a sell forex signal here.
The price is facing the 20 SMA (grey) on the H4 chart, which also provided resistance last week. On the H1 chart, we have the 100 SMA (green) doing that job. I t has rejected the price a few times already and EUR/GBP has formed a doji candlestick below the 100 SMA, which is a bearish reversing signal after the climb. Now, we are waiting for the reversal down and for the bearish trend to resume.
- Check out our free forex signals
- Follow the top economic events on FX Leaders economic calendar
- Trade better, discover more Forex Trading Strategies
- Open a FREE Trading Account
- Read our latest reviews on: Avatrade, Exness, HFM and XM
Related Articles


Sidebar rates
Related Posts
