Bitcoin Heading Down After Failing Below the 50 Daily SMA


Cryptocurrencies have been bullish since the middle of March, following the big crash back then on the coronavirus outbreak. BITCOIN claimed all the losses from that crash and climbed above February’s high at $10.500, reaching $12,500 by the middle of August.
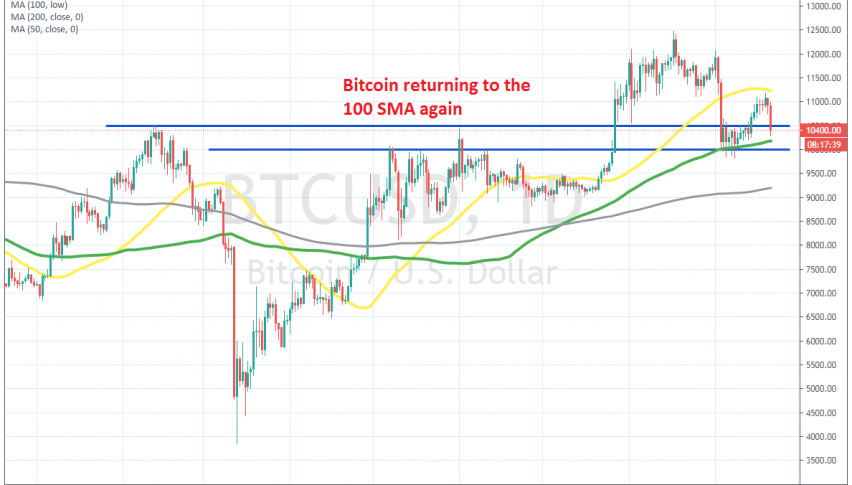
But, that’s when buyers gave up and we saw a reversal in August. A head and shoulders pattern formed during last month and once September started, we saw a dive lower below $10,000 in a few days. This shows that the head and shoulders pattern from August worked out fine in Bitcoin.
Although, no candlestick closed below the $10,000 level or the 100 SMA (green) whihc tells us that the area down there has turned into support. The price reversed back up later this month, but buyers gave up below the 50 SMA (yellow) this time and the price is heading down to the 100 SMA and the $10,000 level. We will see if the support area will hold again, but if it does and a bullish reversing candlestick forms, then we might go long from there.