GBP/USD Bouncing Between 2 MAs Since Monday


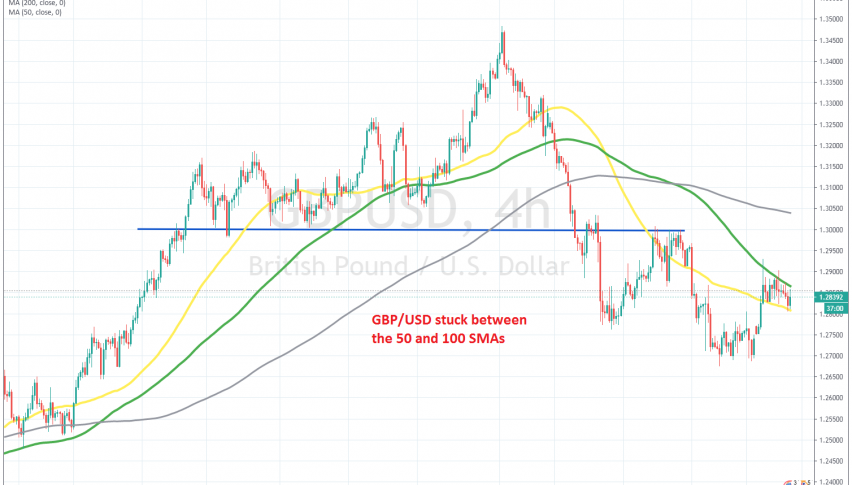
GBP/USD made the biggest crash when the coronavirus broke out in Europe, losing around 18 cents, but it also was among the most bullish pairs during the coronavirus, climbing around 21 cents, from 1.14 to 1.35. Although, GBP/USD reversed back down from 1.35, which seems to have formed a strong resistance area for this pair.
Moving averages were doing a good job in providing support during the climb for GBP/USD, but they got broken without much hesitation in the first two weeks of this month, as the price came down form the highs. That was a sign that the bullish trend was over and sellers had come back again, after several months.
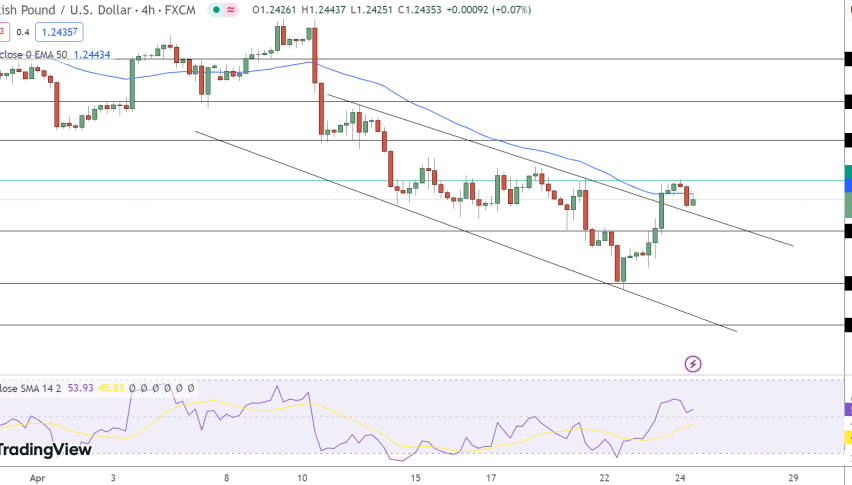
The price fell more than 8 cents until this week, but buyers decided to come back and we have seen a pullback higher since Monday. The price climbed more than 200 pips, pushing above the 50 SMA (yellow) on the H4 chart, but the 100 SMA (green) held well as resistance, despite being pierced.
This MA has been pushing the price lower, while the 50 SMA has now turned into support. So, GBP/USD is trading between these two moving averages. We might trade the breakout in either direction, but the downside seems more favourable now.