Crude Oil Moves Above the 50 Daily SMA Again
Crude Oil has turned bullish again and climbed above the 50 SMA on the daily chart
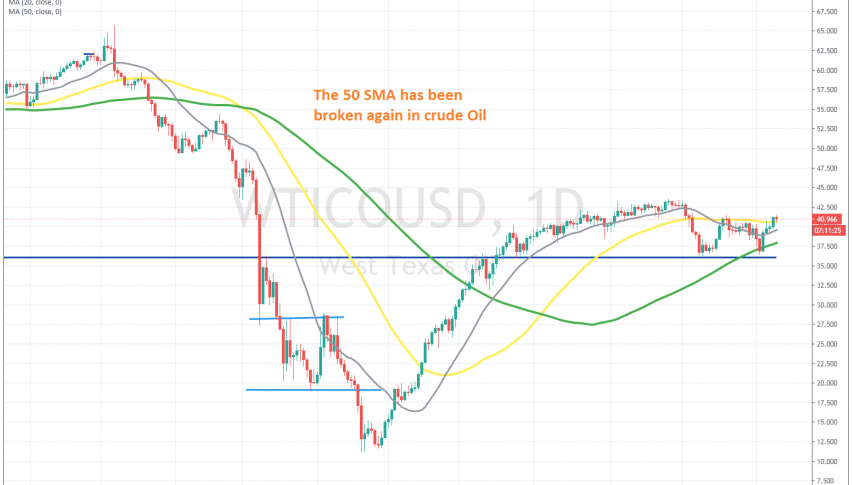
Crude Oil has been trading on a bullish trend since the middle of April, following the crash to -$37.50 in US WTI crude during the pain months earlier. US Oil climbed to $43.50 by the end of August, but in early September the price reversed down.
During the bullish trend, the smallest moving average, which is the 20 SMA (grey), was providing support, pushing the price up, with the pace of the increase being quite strong. But, gains were getting smaller in late summer, which was a sign that the bullish momentum was coming to an end.
The reversal came in September and moving averages were broken. WTI crude lost around $7.5, but the decline stopped at $36, which used to be support and resistance before. The price bounced from there, but the 50 SMA stopped the climb and Oil returned back down.
Although, buyers came back and now they have pushed the price above $40 and the 50 SMA. This is a sign that the bullish momentum is not over for Oil, although, the recent USD weakness has also helped, so we will see if Oil will hold on when the USD buyers return.
- Check out our free forex signals
- Follow the top economic events on FX Leaders economic calendar
- Trade better, discover more Forex Trading Strategies
- Open a FREE Trading Account
- Read our latest reviews on: Avatrade, Exness, HFM and XM
Related Articles


Sidebar rates
Related Posts
