Crude Oil Moves Above the 50 Daily SMA Again
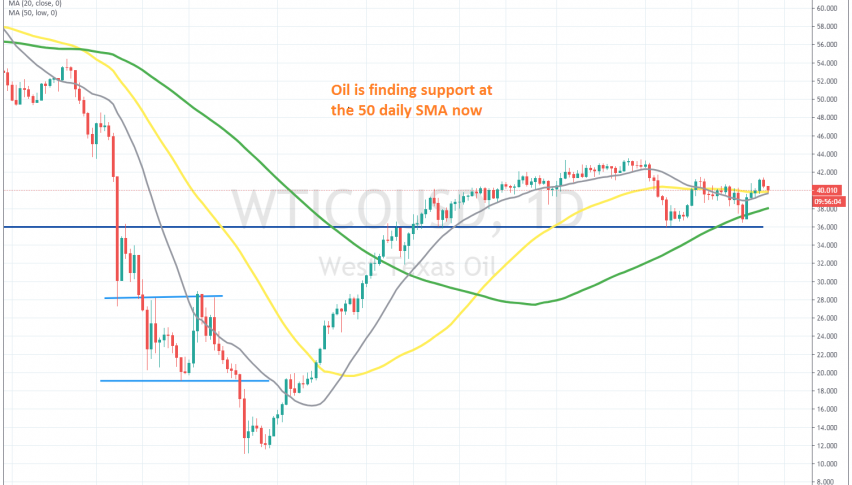
Crude Oil was very bullish for several months, starting from the middle of March and continuing until September 1, when US WTI Oil reversed down from $ 43.50. The price finally broke below the 20 SMA (gray) which had been holding as support since late June, pushing the price higher.
The 50 MA (yellow) was also broken on the daily chart, but the decline stopped at $ 36, which was previously a support and resistance level. The price bounced off that level and climbed above the 50 SMA again. But, it reversed down at $ 41.50, after forming a doji candlestick.
The lower high was a sign that the trend was changing, and oil fell to near the previous support level, before bouncing up again from the 100 SMA (green). Then the price climbed above the 50 SMA and the $ 40 level, and now it seems like WTI Crude Oil is finding support at the 50 SMA. This has shifted the situation for oil now, and we are back on the bullish trend, as long as the price stays above the 50 SMA. This might be a good place to buy oil intra-day, with small trades.


