The 50 SMA Turns into Resistance for Gold, Bringing An End to the Retrace Up
Gold retraced higher in the last two weeks, but the 50 SMA stopped the climb and reversed it back down
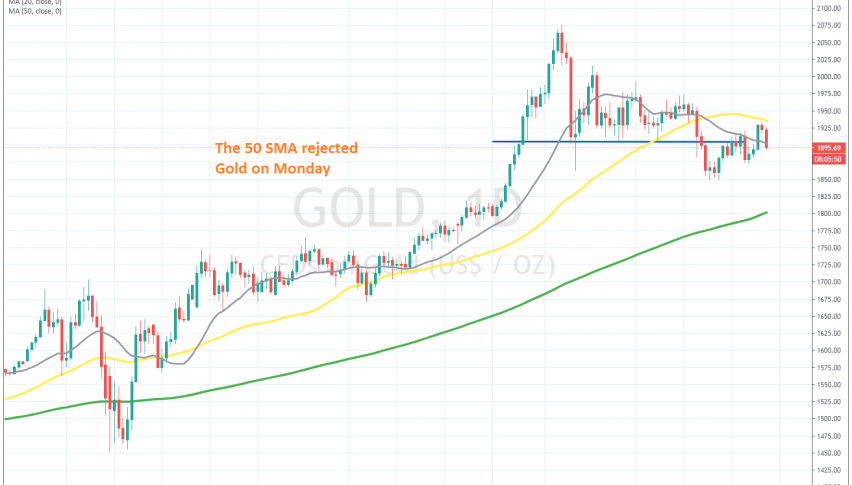
GOLD was really bullish this year, until the first week of August, when it turned lower. The deteriorating sentiment due to the economic meltdown from the coronavirus turned the attention to safe havens and as a result, Gold surged above $2,000 as the ultimate safe haven.
But, the bullish momentum ended in the first week of August and Gold started making lower highs. Although a support area formed above $1,900 and Gold traded in a triangle until late September, when it made another leg lower, falling more than $1,000 pips.
Although, in the last two weeks we have seen Gold climb higher again, which raised the question if the bullish trend was over for real. But, the 50 SMA (yellow) turned into resistance on the daily chart, answering that question and ending the bullish retrace. Gold reversed back down this week and yesterday it fell nearly 400 pips. This is a strong sign that the bullish trend is over for real, although the last confirmation will come when the previous lows get broken.
- Check out our free forex signals
- Follow the top economic events on FX Leaders economic calendar
- Trade better, discover more Forex Trading Strategies
- Open a FREE Trading Account


