Shorting the Retrace in EUR/CHF at the 100 SMA
EUR/CHF was retracing higher this week, but the climb seems to have ended at the 200 SMA
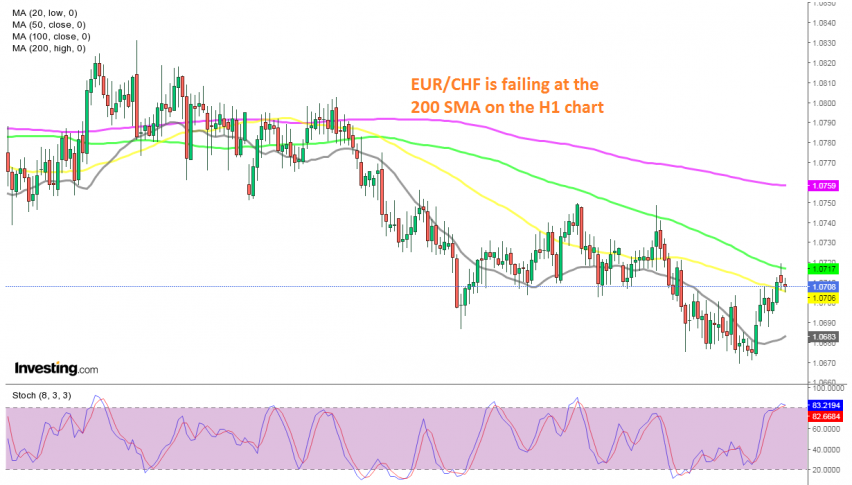
EUR/CHF was trading sideways in a range from the middle of July, until the second week of October. The top of the range was around 1.0840-60 while the bottom stood around 1.0720. But, the Euro turned bearish back then, while the CHF increased as the deteriorating market sentiment sent safe havens higher.
The 100 SMA on the daily chart which was acting as support in early October, was broken and turned into resistance, while the 200 SMA turned into support on that time-frame chart. On the H4 chart, the 100 SMA turned into resistance in recent days, as shown below.
Last week, we saw another move lower, taking this pair to 1.0670. But, yesterday EUR/CHF reversed higher and was climbing until a few hours ago, reaching the previous support area at 1.0720. The 100 SMA was waiting up there and it provided resistance for the second time. EUR/CHF started to reverse back down and we decided to open a sell forex signal below the 100 SMA. Now the price is reversing down again, so this trade looks OK.
- Check out our free forex signals
- Follow the top economic events on FX Leaders economic calendar
- Trade better, discover more Forex Trading Strategies
- Open a FREE Trading Account
- Read our latest reviews on: Avatrade, Exness, HFM and XM
Related Articles


Sidebar rates
Related Posts
