EUR/JPY Bouncing Between MAs on the Daily Chart


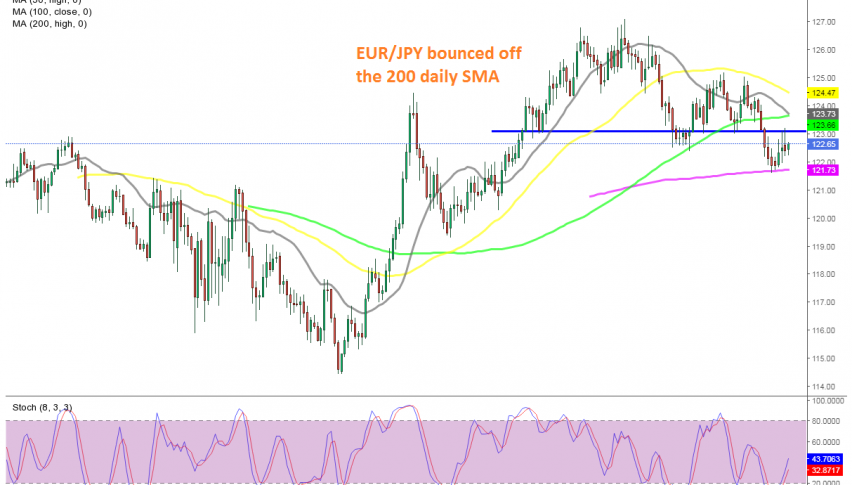
The EUR/JPY turned quite bullish from May until the end of August, when this pair climbed briefly above 127. During the climb, the 20 SMA (gray) was providing support on the daily chart, but it got broken in the first week of September, when the trend started to reverse down.
The 50 SMA (yellow) and the 100 SMA (green) were broken, but the 200 SMA (purple) held as support on that time-frame chart last week, and this week the EUR/JPY is bouncing higher, as the Euro gains some momentum on the back of the weak USD, due to the presidential elections.
As a result, this forex pair has climbed around 150 pips this week, but the area around 123, which acted as both support and resistance before, stopped its climb. The 20 SMA also added to the resistance, and the price formed another doji candlestick. This points to a bearish reversal and a continuation of the downtrend. We might try to go short, but the US elections could ruin any trade, so we will see how they go.