Gold’s Failure to Hold Gains This Week, Indicates That the Trend Will Remain Bearish
Gold signaled a bullish reversal this week, but has ended up even more bearish now
Gold turned bearish in the second week of August, not too late after it made some record highs, pushing above $ 2,000 in the first week of that month. The economic from all over the world data was really strong back then, after the rebound following the global reopening.
As a result, Gold lost more than $ 300 from top to bottom in about four months, which suggests that the long term trend might have turned bearish, after being bullish for more than two years. Moving averages were providing some form of support as the price was slipping lower, but eventually got broken as sellers kept pushing down.
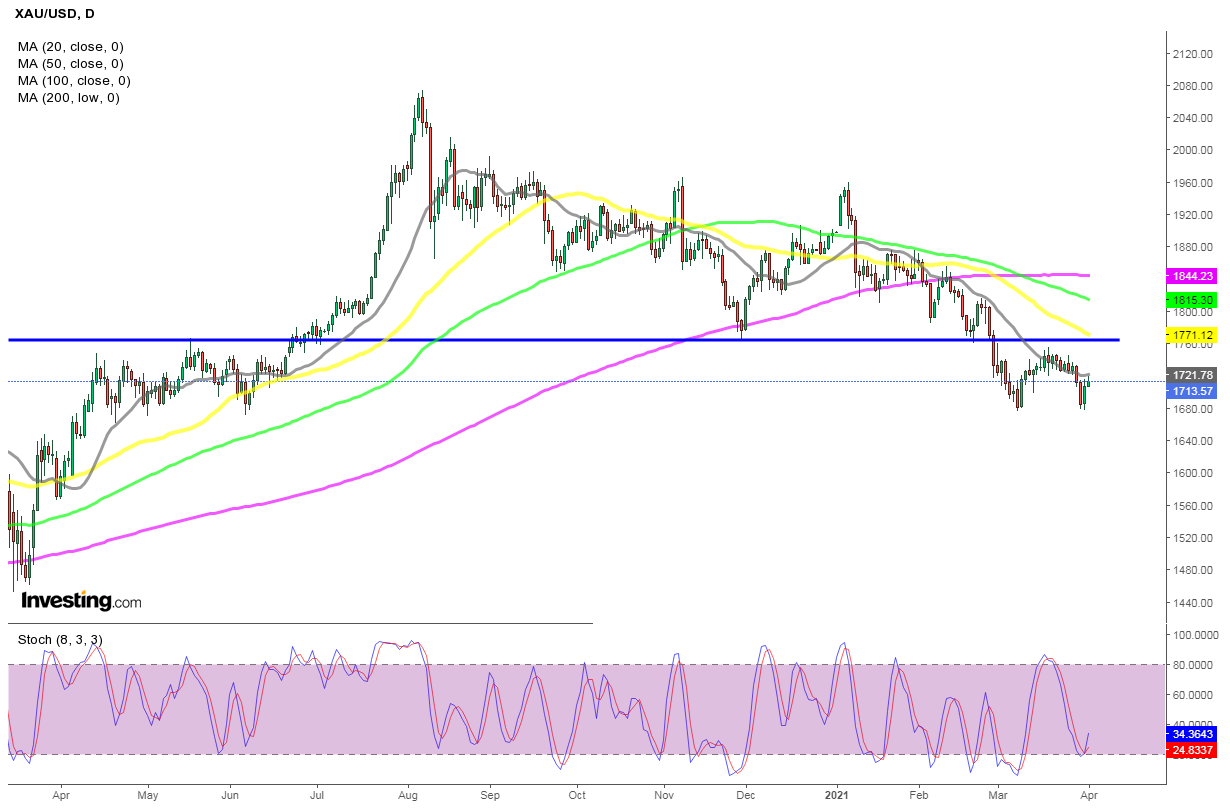
Although, the 200 SMA (purple) held as support on the last day of November in the daily chart and GOLD bounced off that moving average. December was quite bullish, with buyers pushing above the moving averages, as well as the descending trend line. But, the trend reversal wasn’t official unless the high from early November was broken.
That didn’t happen and on Wednesday Gold reversed back down, after the EU approved one of the vaccines for the coronavirus, I can’t remember which one. That improved the sentiment, even tough we were expecting it and safe havens turned bearish. They have been bearish since then, with USD/JPY climbing around 150 pips. Gold has lost more than $ 100 during the last few days. So, Gold seems to have turned bearish again and now the next target for sellers is the 200 SMA at $ 1,800.
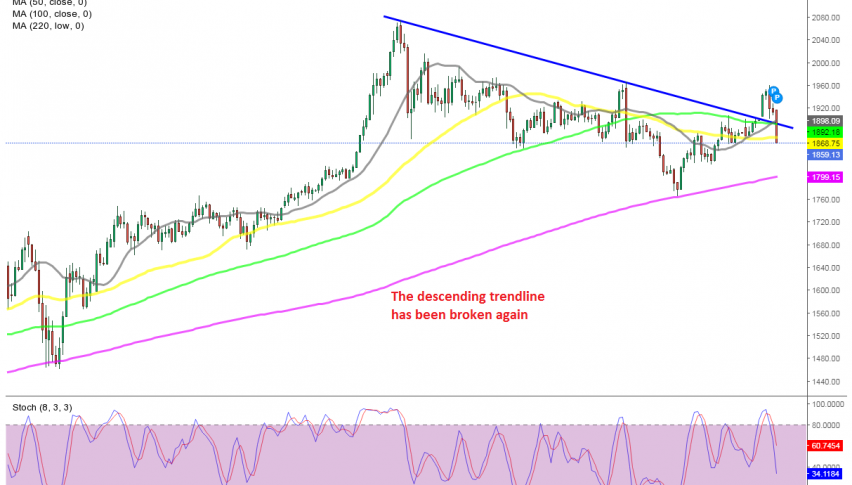
The price is heading for the 50 SMA now
On the weekly chart, Gold found support at the 50 SMA (yellow) at the end of November and bounced off of that moving average, which rejected the price during the coronavirus crash in March last year. The price moved above the 20 SMA (grey) this week which led some traders to believe that the trend was changing. But, the first decent test was at the early November highs, which it failed.
The price returned back down below the 20 SMA and now it’s heading for the 50 SMA (yellow). This retest of the 50 SMA comes quite soon after the precious one, suggesting that sellers might finally break below it. We will follow the price action and probably open a sell trade when that happens, which will probably be next week, so follow our lives forex signals page.
- Check out our free forex signals
- Follow the top economic events on FX Leaders economic calendar
- Trade better, discover more Forex Trading Strategies
- Open a FREE Trading Account
- Read our latest reviews on: Avatrade, Exness, HFM and XM
Related Articles


Sidebar rates
Related Posts
