Gold Reverses Down, After Failing to Turn Bullish at the 200 SMA
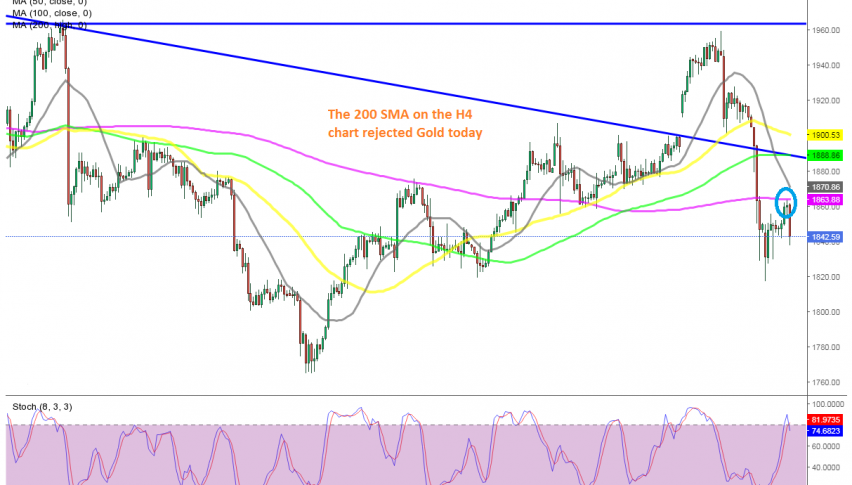
Gold has declined $ 25 lower after failing at the 200 SMA on the H4 chart
It seems like the bearish trend is back on for GOLD . Safe havens surged from the last week of March, following the initial coronavirus crash, but the bullish run ended in the second week of August, after Gold made some record highs above the $ 2,000 level.
They turned bearish back then and Gold lost more than $ 300, but during December Gold turned bullish, although that was just a retrace. before the bearish trend resumed again. Last week the retrace ended and Gold declined more than $ 140, after the EU approved one of the vaccines.
Yesterday we saw an attempt at reversing the price higher and the price retraced up, but the pullback seems over now. Buyers ran into the 200 SMA (purple), which has been acting as support and resistance before. They failed to break that moving average and after a doji candlestick, which is a bearish reversing signal, the price turned bearish and Gold lost around $ 25. So, sellers remain in charge in Gold and retraces higher should be good opportunities to go short.
- Check out our free forex signals
- Follow the top economic events on FX Leaders economic calendar
- Trade better, discover more Forex Trading Strategies
- Open a FREE Trading Account
- Read our latest reviews on: Avatrade, Exness, HFM and XM
Related Articles


Sidebar rates
Related Posts
