Selling the Retrace in USD/JPY at the 100 Daily SMA


[[USD/JPY]] has been bearish for nearly a year now, since the long term USD decline started. During this time, USD/JPY has lost around 9 cents from top to bottom, as moving averages kept pushing this pair down.
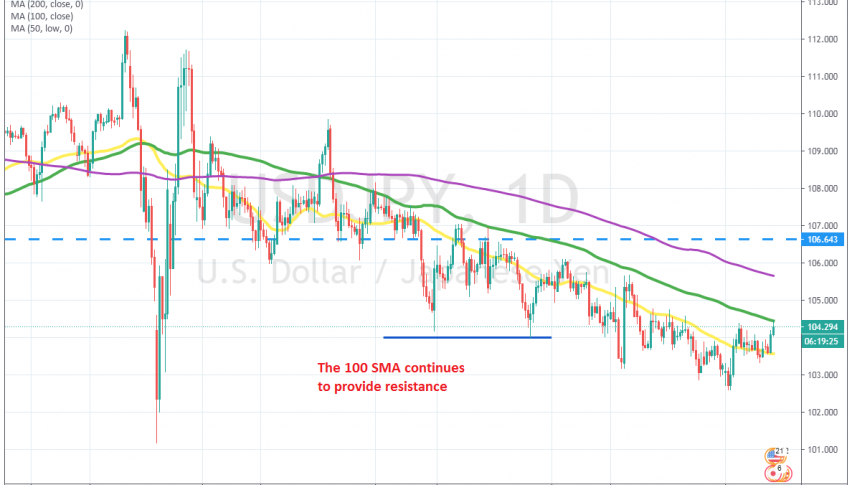
The downtrend has been consistent, with the 100 SMA (green) providing solid resistance during retraces on the daily chart. The 50 SMA (yellow) has helped as well, particularly in the last two months of 2020, as the USD decline picked up pace.
But, we have seen a retrace higher take place after the first week of January. The 50 SMA couldn’t hold as resistance, instead it turned into support once it was broken. But, I have bigger expectations for the 100 SMA, which rejected the price in the first attempt. We decided to take a position and opened a sell forex signal. , Now let’s hope the the reversal continues.