No Trend Reversal in USD/CAD, As the 50 Daily SMA Keeps Pushing It Down
USD/CAD is heading for the lows below 1.26 now, after failing at the 50 daily SMA
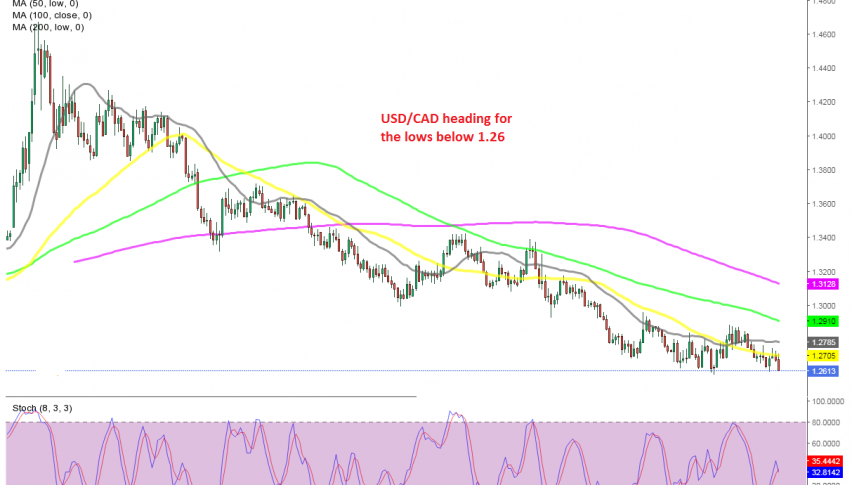
The USD/CAD has been on a continuous bearish trend since March last year. The decline in the USD has been a main factor in this decline, but the bullish momentum in crude oil has also been helping considerably to push the CAD higher, since the Canadian Dollar is closely correlated to oil prices most of the time.
During this time, we have seen occasional retraces higher, but moving averages have stopped them, reversing the price down and pushing the downtrend further. The 100 SMA (green) has been the main indicator providing resistance, but the 50 SMA (yellow) has also helped since December last year.
Earlier this year, we saw a retrace higher, which took the price above the 50 SMA (yellow) on the daily chart, suggesting a possible bullish reversal. But the USD decline resumed and the price turned bearish again for the USD/CAD, which is now heading for the lows at 1.2590. So, the USD/CAD remains bearish, and we will try to sell retraces higher on the smaller time-frame charts.
- Check out our free forex signals
- Follow the top economic events on FX Leaders economic calendar
- Trade better, discover more Forex Trading Strategies
- Open a FREE Trading Account
- Read our latest reviews on: Avatrade, Exness, HFM and XM
Related Articles


Sidebar rates
Related Posts
