The Long-Term Trend Is Officially Bullish Now in USD/JPY
Moving averages are pushing USD/JPY higher, confirming the bullish trend
USD/JPY was on a long term bearish trend, which started in March last year and continued until early January this year. Safe haven currencies were attracting traders due to the increased uncertainty, while the USD was on a long term decline.
As a result, this pair fell around 9 cents, with moving averages pushing it down on the monthly chart, particularly the 100 SMA on the daily chart. But that moving average broke at the end of January, indicating a possible trend reversal.
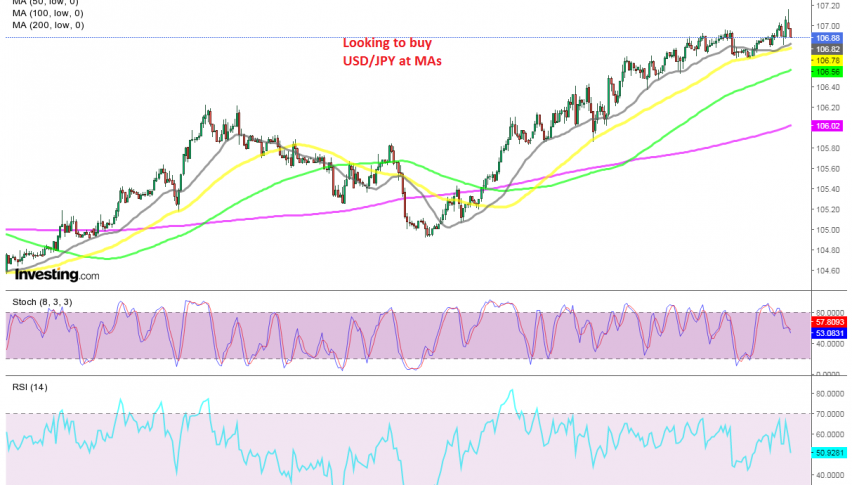
Now the reversal is confirmed and the bullish trend is official. USD/JPY has broken above all moving averages on the daily chart, which have now turned into support, while on the H1 chart above we have the 20 SMA (gray) and the 50 SMA (yellow) which have been the ultimate support indicators, pushing the price higher. This pair has broken above 107 now, so the trend is up and we will try to buy pullbacks, probably at the 20 smA or 50 SMA.
- Check out our free forex signals
- Follow the top economic events on FX Leaders economic calendar
- Trade better, discover more Forex Trading Strategies
- Open a FREE Trading Account
- Read our latest reviews on: Avatrade, Exness, HFM and XM
Related Articles


Sidebar rates
Related Posts
