Gold Price Prediction: Ascending Triangle Pattern, Brace for Breakout Trade
The yellow metal gold prices were closed at 1729.25 after placing a high of 1733.10 and a low of 1719.35. After falling for two consecutive

The yellow metal GOLD prices closed at 1729.25 after placing a high of 1733.10 and a low of 1719.35. After falling for two consecutive days, gold prices posted minor gains on Monday ahead of the US Federal Reserve meeting. The US dollar was weak on Monday despite the stronger-than-expected macroeconomic data on the day. It was due to the upcoming Tuesday and Wednesday’s Federal Reserve monetary policy meeting for March. Traders were awaiting the meeting results and were cautious about placing any strong position ahead of it, ending up having a consolidated movement in the yellow metal.
The Federal Reserve is expected to hold its interest rates at the current level near zero as it has not changed them over the past year since the outbreak of the coronavirus pandemic. However, expectations were high that Fed Chair Jerome Powell would express some concerns over the stunning selloff in the Treasury markets this year. The yields on the benchmark 10-year Treasury note rose above their pre-pandemic highs of 1.6% over the past month and have been consistently moving within this range.
The rising yields over the increasing prospects of economic recovery and increasing inflation have been weighing on gold for the past few months. This surge in yields has also affected the inflation-hedge status of the safe haven metal that is now slowly trying to creep back after months. However, the Fed’s signs of intensifying bond-buying could halt the rising bond yields and spark a rally in the precious metal in the coming months. Gold has been considered as a hedge against inflation and store of value against worries for decades, but in recent months the US dollar and bond yields have taken its place and have been rising since the prospects of economic recovery have returned.
The surge in bond yields came in after the argument that the economic recovery in the coming months could extend beyond Federal Reserve’s expectations and lead to high inflation as the central bank has no intentions to raise interest rates above near-zero level.
The US Dollar that usually falls in heightened inflation fears also rose on the same logic for economic recovery. The greenback’s status as a reserve currency also strengthened its safe-haven standing and led to traders taking long positions in the dollar. The US Dollar Index has returned to the bullish level of 92 in recent weeks and has been weighing further on the gold prices.
On the data front, at 05:30 GMT, the Empire State Manufacturing Index from the US improved to 17.4 against the expected 14.6 and supported the US dollar that ultimately capped further gains in the gold prices on Monday. However, gains at the starting day of the week could be attributed to the easing signs of the US Treasury yields and US Dollar value at the day ahead of the US Fed meeting for March.

Daily Technical Levels
Support Resistance
1721.24 1727.74
1718.72 1731.72
1714.74 1734.24
Pivot Point: 1725.22
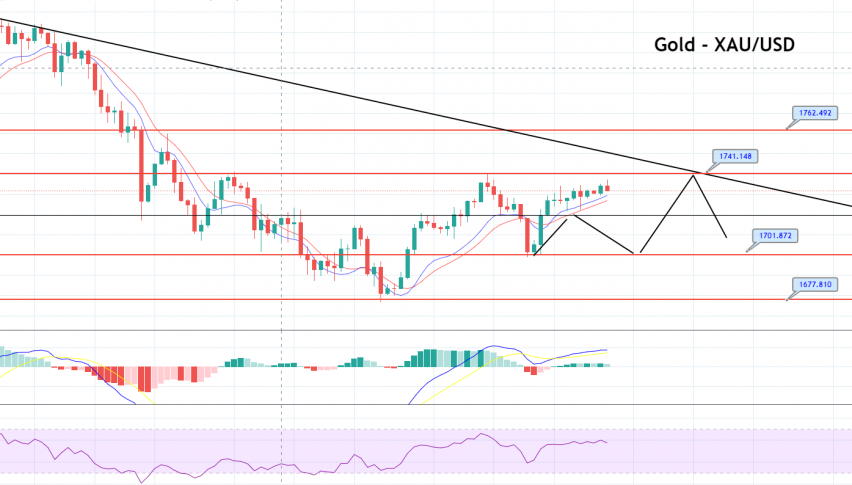
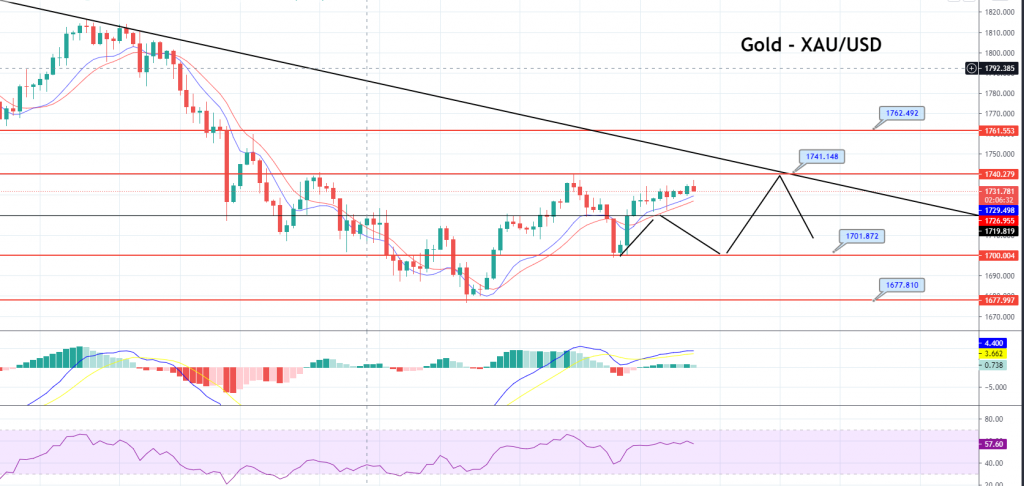
GOLD continues trading with a bullish bias at 1,734 area, facing immediate resistance at 1,739 level. On the 4 hour timeframe, gold has formed an ascending triangle pattern that’s likely to offer an immediate resistance at the 1,739 marks. Bullish crossover of this level can lead the precious metal towards the next resistance area of 1,760. At the same time, the support level holds around 1,721 levels today. The RSI and MACD are in support of a bullish trend. Thus, let’s brace for a triple top breakout at 1,739 before expecting further buying in gold. Good luck!
- Check out our free forex signals
- Follow the top economic events on FX Leaders economic calendar
- Trade better, discover more Forex Trading Strategies
- Open a FREE Trading Account


