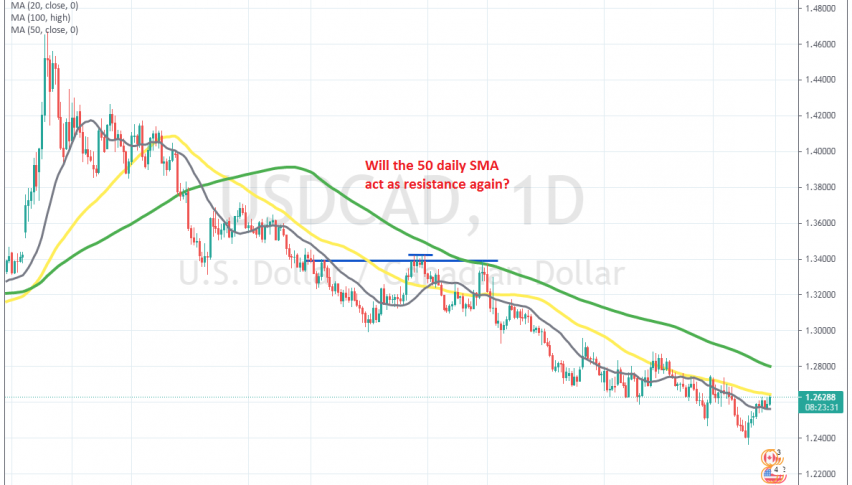
Is the 50 SMA Going to Keep USD/CAD Down Again?


USD/CAD has been bearish for about a year now, since it reversed down at the middle of March last year. Initially we saw a surge in this pair when the coronavirus broke out in Europe and the US, sending this pair nearly 15 cents higher, as crude Oil prices were crashing.
But, the crash in Oil ended after US WTI crude fell to $-37. Oil has been bullish since then, helping the CAD. As a result. USD/CAD has been bearish since then, losing around 23 cents from the top to the bottom.
But, the surge in crude Oil prices came to an end earlier this month and it has fallen nearly 10 cents from the top. USD/CAD has reversed higher, climbing aro0und 3 cents up, but it has run into the 50 SMA (yellow) on the daily chart which has providing solid resistance recently, keeping the bearish trend going.
So, this is a big test for this pair; if it break above, it might spurge panic among sellers, which would accelerate the climb. But, let’s observe the price action to see which side will take the upper hand now. If buyers fail to push above soon, we might open a sell signal here, since it would be a sign that the retrace higher is complete.