USD/CAD Failing at MAs Once Again, Confirming That Sellers Remain in Charge


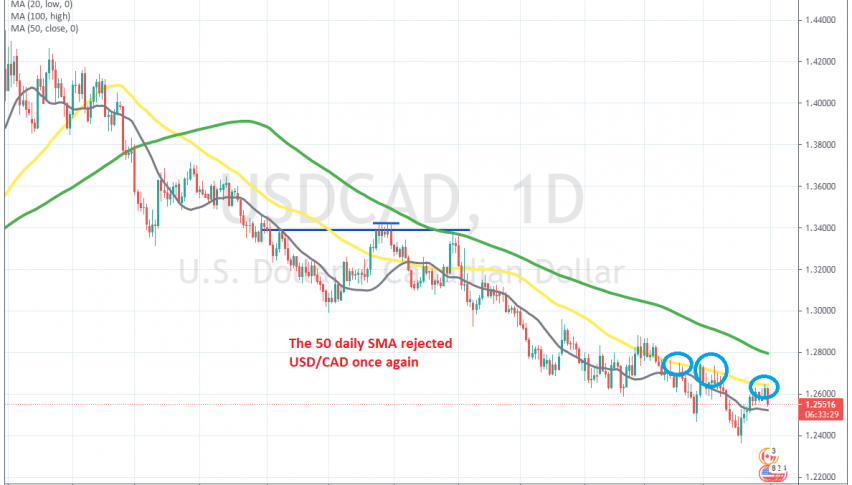
Yesterday I posted an article about USD/CAD and how buyers were trying to break the 50 SMA (yellow) on the daily chart. That moving average has been providing resistance for this pair during this year, although the price has been trading below it for about a year, which shows that the trend has been quite bearish during this time.
USD/CAD was trading at around 1.2650 yesterday when I posted the USD/CAD forex update. Today, we find this pair trading 100 pips lower at 1.2550s, which means that buyers failed to break the 50 daily SMA and they gave up, leaving this pair to the sellers.
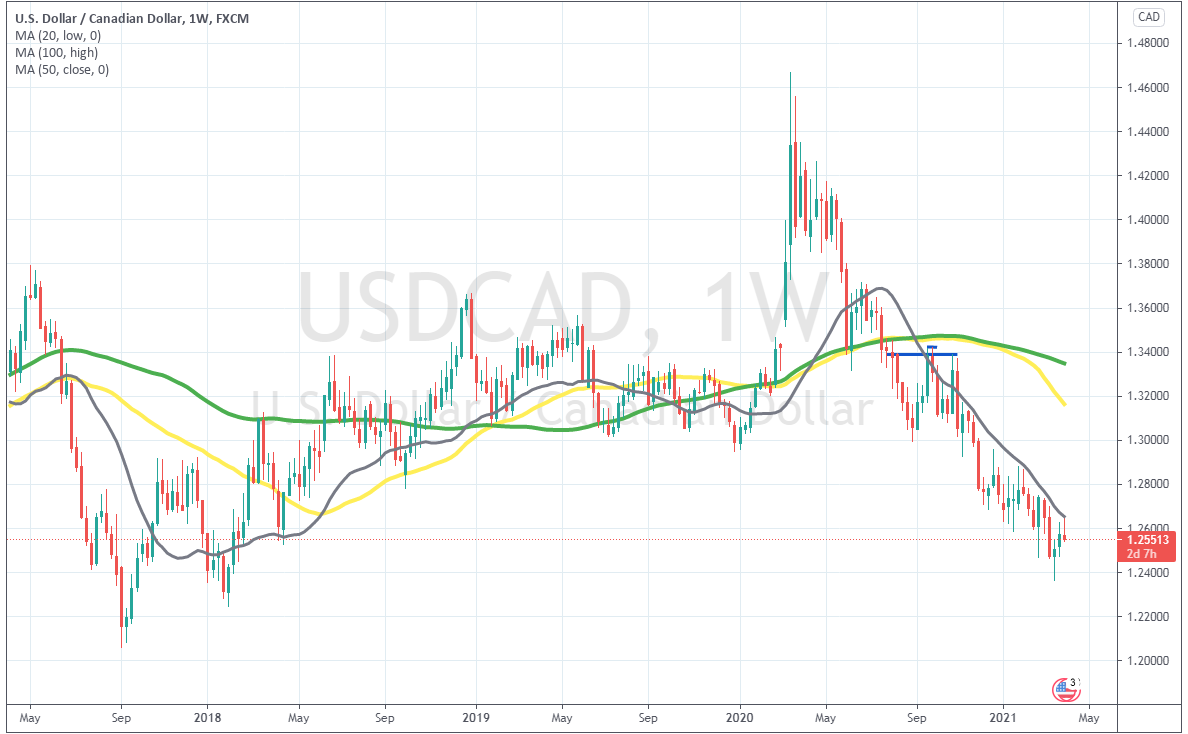
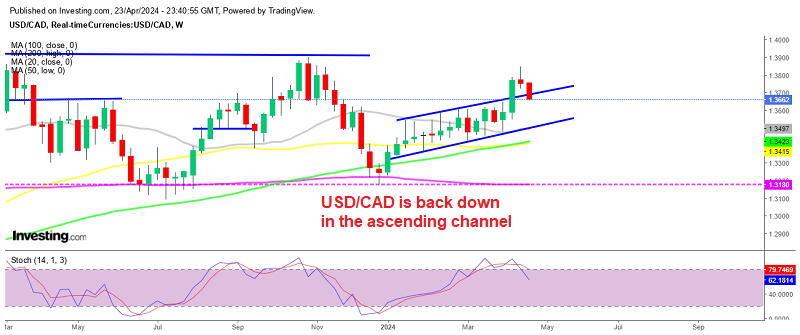
The 20 weekly SMA keeps pushing USD/CAD down
On the weekly chart we see that the 20 SMA (gray) has been the ultimate resistance for this pair, pushing it down since late last year. We see that the daily candlestick now looks like an upside-down hammer, which is a bearish reversing signal after the short-lived retrace up in the previous two weeks, after being rejected by the 20 SMA again yesterday. So, the trend remains bearish here and we will try to find another opportunity to go short.