Ethereum Price Forecast: Symmetric Triangle Pattern in Play, Trade the Range!
The ETH/USD was closed at 2088.9 after placing a high of 2103.62 and a low of 1946.54. ETH/USD continued its bullish streak for the sixth
Written by:
Arslan Butt
•
Monday, April 5, 2021
•
2 min read
•
Last updated: Monday, April 5, 2021

The ETH/USD closed at 2088.9 after placing a high of 2103.62 and a low of 1946.54. ETH/USD continued its bullish streak for the sixth consecutive session on Friday and reached above 2100 level. Ethereum crossed the key level of $2000 on Friday and even reached above the $2100 level for the first time in its history. The recent all-time high prices could be attributed to the popularity of cryptocurrency in the market that drove the king of cryptocurrencies, BITCOIN, above its all-time high level of $60,000 on Friday.
The rising prices of Bitcoin also pulled the Ethereum prices with itself, and ETH reached its ATH in 2021 to above the $2100 level. While Ethereum prices were placing new highs, the miners on the networks were pulling great profits. Etherscan suggested that the ETH highest average Hash Rate was recorded on April 3rd with 493,933. The Hash Rate of Ethereum climbed over 750 Mega hash per second.
The Ethereum rally was also supported by the recent announcement from a high-profile company Visa that allowed its users to use USDC on the Ethereum blockchain network to settle transactions. The increased adoption by retailers and big institutions and the major payment platforms boosted the prices of cryptocurrencies, including Bitcoin, Ethereum, and other coins. The latest rise in Ethereum to its ATH level came amid the crypto market frenzy. The upcoming upgrade of the Ethereum Network that is expected to reduce the high gas fees of the network has also improved the outlook of Ethereum that is also adding to its value.

Daily Technical Levels
Support Resistance
2030.15 2097.12
1985.50 2119.44
1963.18 2164.09
Pivot Point: 2052.47
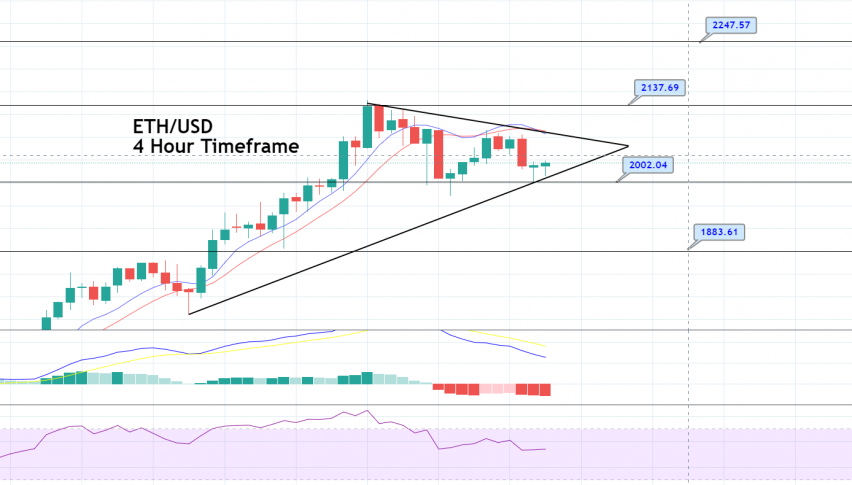
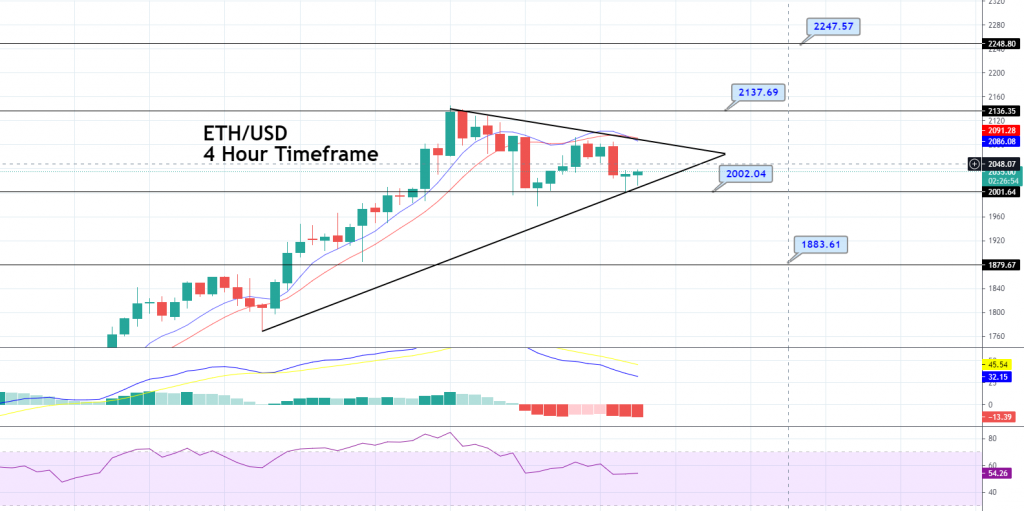
ETH/USD is trading sideways at 2,035, gaining support at the 2,002 level. Violation of this level can lead the pair towards the 1,883 level, whereas the violation of the 2,086 level can lead the price towards the 2,137 level. The MACD and
RSI levels are suggesting a bullish trend, while the 20 & 50 EMA also support a selling bias. All we need right now is to wait for an asymmetric
triangle breakout that can lead the ETH/USD pair towards the 1,883 level. Conversely, a bullish breakout of 2,086 level can drive buying until 2,137 and 2,247. Good luck!
Arslan Butt
Lead Markets Analyst – Multi-Asset (FX, Commodities, Crypto)
Arslan Butt serves as the Lead Commodities and Indices Analyst, bringing a wealth of expertise to the field. With an MBA in Behavioral Finance and active progress towards a Ph.D., Arslan possesses a deep understanding of market dynamics.
His professional journey includes a significant role as a senior analyst at a leading brokerage firm, complementing his extensive experience as a market analyst and day trader. Adept in educating others, Arslan has a commendable track record as an instructor and public speaker.
His incisive analyses, particularly within the realms of cryptocurrency and forex markets, are showcased across esteemed financial publications such as ForexCrunch, InsideBitcoins, and EconomyWatch, solidifying his reputation in the financial community.
Related Articles