Ethereum Price Forecast – Ascending Triangle Pattern, Bullish Bias Dominates!
The ETH/USD was closed at 2136.59 after placing a high of 2144.86 and a low of 2136.59. ETH/USD declined on Monday despite the rapidly growi
The ETH/USD was closed at 2136.59 after placing a high of 2144.86 and a low of 2136.59. ETH/USD declined on Monday despite the rapidly growing institutional interest in Ethereum. On Monday, the decline in Ethereum prices could be attributed to the recent fall in Bitcoin prices amid negative developments in the cryptocurrency market.
Bitcoin began its week with negative momentum amid the warning issued by the Central Bank of Sri Lanka. CBSL issued a general warning about the cryptocurrency investment due to the involved high level of risk. The Bank said that investment in Bitcoin, Ethereum, and other altcoins comes with a higher level of risks and is banned. Sri Lanka does not allow any of the means to obtain digital currency such as exchanges, mining, or via ICOs.
Another negative news related to the cryptocurrency market on Monday came in after a top Bitcoin exchange CEO gave a warning. Jesse Powell said that governments around the world might start to clamp down on the use of Bitcoin and other cryptocurrencies. He referred to the latest warnings from various officials, including the US Treasury Secretary and European Central Bank President, who have warned about the use of Bitcoin for money laundering, illegal activities, and terrorist funding. These negative developments surrounding the cryptocurrency market added weight to Bitcoin prices that eventually dragged the other altcoins like Ethereum.
On the other hand, the second largest blockchain network, Ethereum, processed about $20.68 billion worth of transactions in the last week that ended on April 11. This led to a record high volume transfer of $8.87 billion that was supportive of the ETH/USD prices. However, the downward pressure from Bitcoin was comparatively high that resulted in minor losses in ETH/USD prices on Monday. Furthermore, it was also reported that Ethereum gas fees have dropped by a massive 50%. This decrease was attributed to the widespread use of Flashbots by traders in place of PGA bots.
Ethereum Daily Technical levels
Support Resistance
2133.84 2142.11
2131.08 2147.62
2125.57 2150.38
Pivot Point: 2139.35
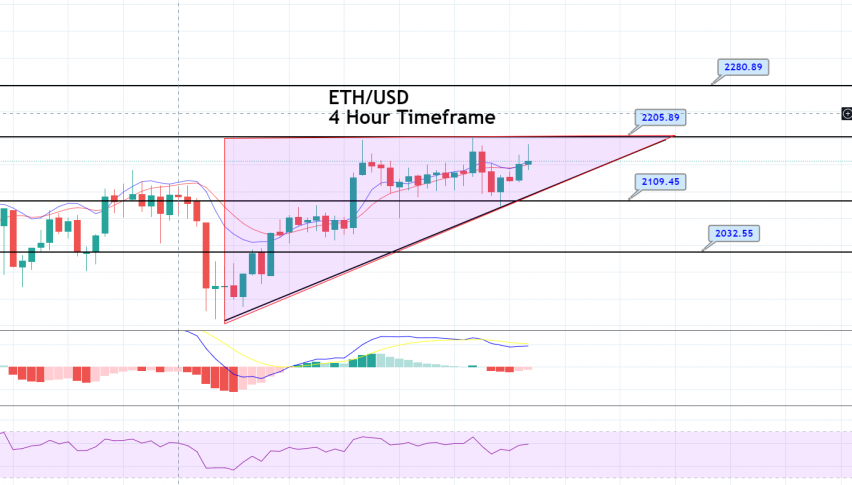
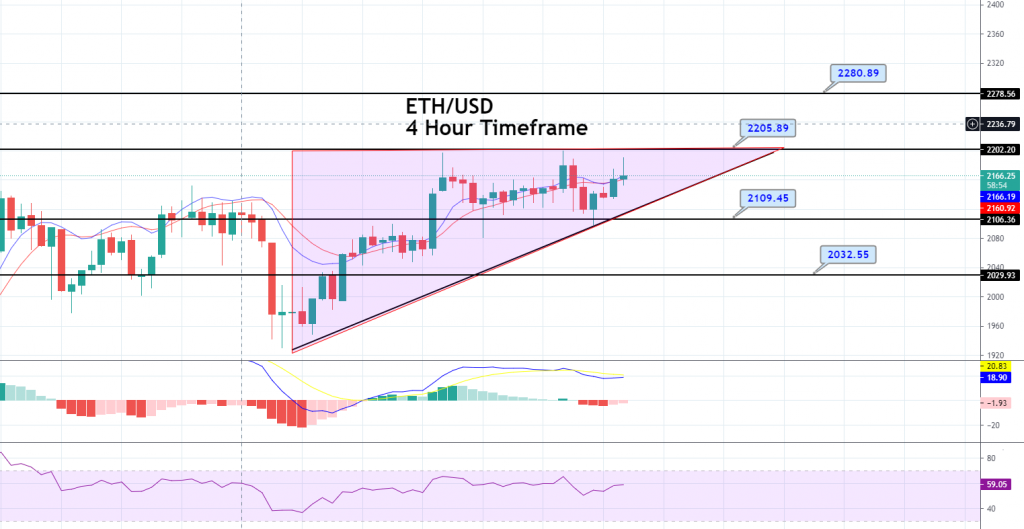
The ETH/USD is trading choppy around 2,175 level, facing immediate resistance at 2205 level. Continuation of further upward trend can extend buying trend until 2,280 level. The 20 and 50 periods EMA are supporting bullish trend, and the MACD and RSI are suggesting mixed bias. Perhaps that’s why the ETH/USD pair has formed an ascending triangle pattern on the four-hourly timeframe. The ETH/USD needs to violate the 2,205 resistance level to exhibit a bullish trend. On the higher side, the next resistance can be found around 2,280 levels, while support prevails at 2109 and 2032. Good luck!
- Check out our free forex signals
- Follow the top economic events on FX Leaders economic calendar
- Trade better, discover more Forex Trading Strategies
- Open a FREE Trading Account