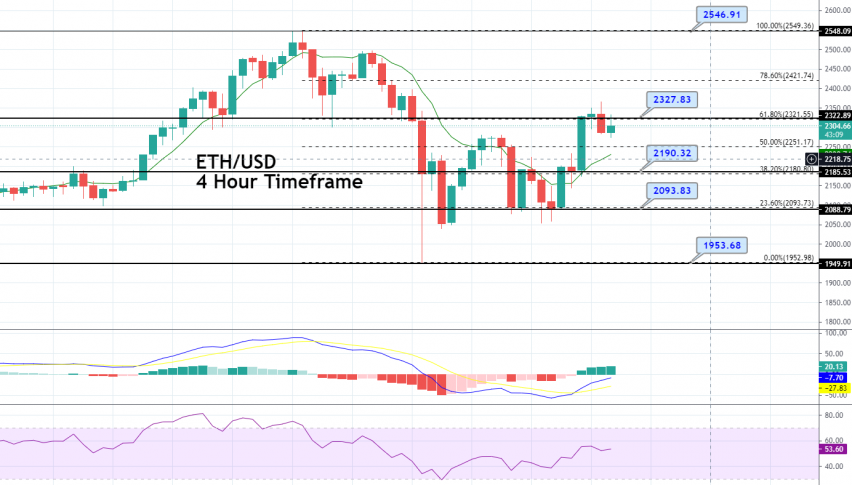
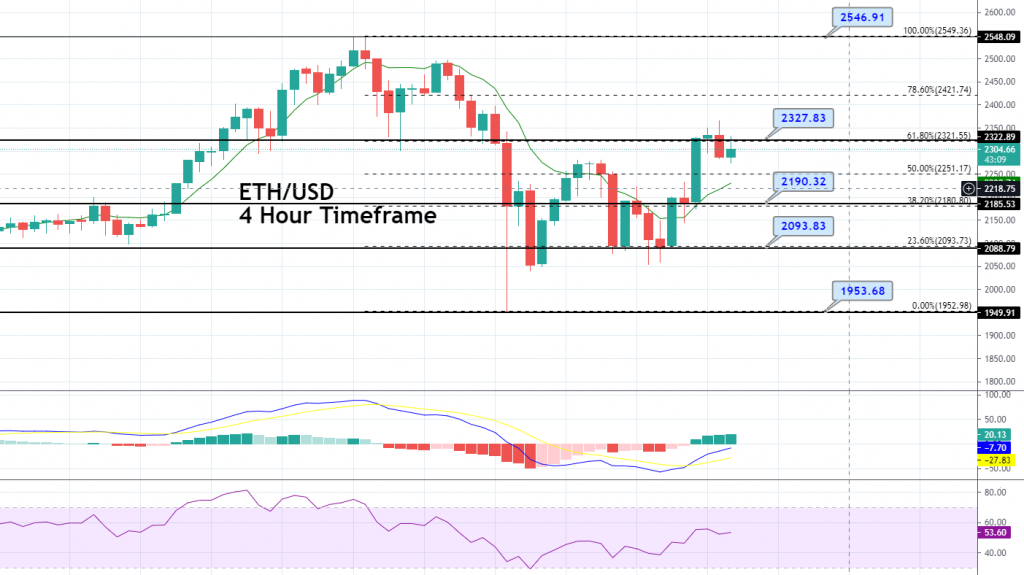
Ethereum Price Forecast – ETH/USD Violates 50% Fibo Level, Buyers Loom!
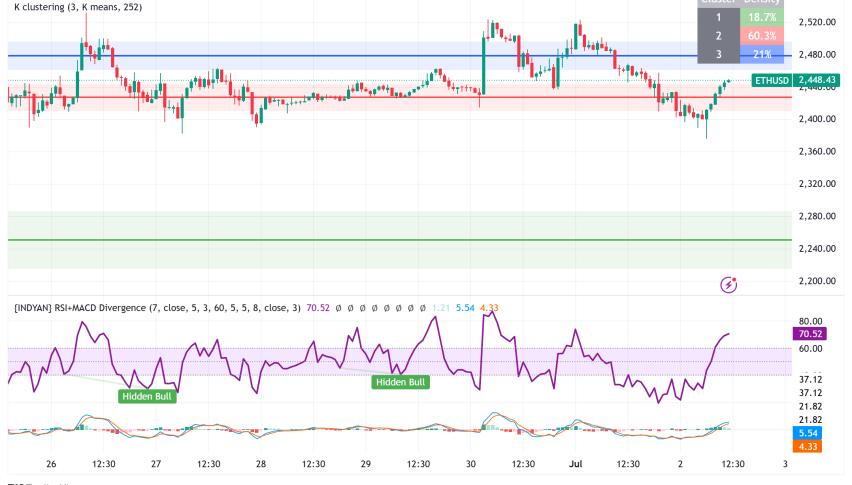
ETH/USD closed at 2332.14 after placing a high of 2345.18 and a low of 2058.00. It broke its bearish streak and rose on Tuesday after
ETH/USD closed at 2332.14 after placing a high of 2345.18 and a low of 2058.00. It broke its bearish streak and rose on Tuesday after falling for four consecutive sessions. The latest positive news from Venmo that it has integrated buying and selling of Bitcoin and altcoins, including Ethereum and others, added strength in the whole crypto market. The digital wallet company with more than 60 million active users will enable its customers to buy, hold and sell cryptocurrencies. This news added a spark in the dull environment of the cryptocurrency market that has been continuously falling for the previous 4-5 days.
Furthermore, the Chicago-based asset manager Rothschild Investment Corp has thrown more funds into Grayscale’s Bitcoin and Ethereum Trust. According to a recent filing with the US SEC, the firm purchased 265,302 shares from Grayscale Ethereum Trust at around $4.75 million. This news also added in the gains of Ethereum prices on Tuesday. Meanwhile, Ethereum whales reached an all-time high as it explodes against BITCOIN. During the recent market crash, some traders panic-sold while Ethereum whales have continued accumulating massive chunks. This resulted in a large number of ETH holders and helped it reach a new all-time high.

ETH/USD Daily Technical Levels
- Check out our free forex signals
- Follow the top economic events on FX Leaders economic calendar
- Trade better, discover more Forex Trading Strategies
- Open a FREE Trading Account