Litecoin Price Forecast – LTC/USD Sideways Trading Range, Brace to Trade Breakout!
LTC/USD closed at 260.801 after placing a high of 261.285 and a low of 257.973. It continued its bearish trend for the fourth consecutive
Written by:
Arslan Butt
•
Wednesday, April 21, 2021
•
2 min read
•
Last updated: Wednesday, April 21, 2021

LTC/USD closed at 260.801 after placing a high of 261.285 and a low of 257.973. It continued its bearish trend for the fourth consecutive session on Tuesday despite improvement in the crypto environment. Litecoin remained almost unchanged during Tuesday’s trading session despite good news circulating in the market related to Venmo integrating buying and selling of cryptocurrencies. The digital wallet owned by PayPal Holding Inc. announced on Tuesday that about 60 million active customers of Venmo will now have access to buy and sell cryptocurrencies, including BITCOIN, ETHEREUM, Litecoin, and Bitcoin Cash.
Litecoin prices should have followed the market trend and gain from this positive news, but LTC/USD continued its bearish streak for the fourth consecutive session and remained under consolidation. The prices even remained flat throughout the day as it seemed like investors were almost inactive during the day. Furthermore, Hello Pal, which offers an international live-streaming, language learning, and social-crypto platform, announced that it had reached an agreement with a company to acquire an interest in Dogecoin and Litecoin mining assets.
Under this agreement, the company will acquire 51% stake in 12,500 mining platforms dedicated to the mining of Dogecoin and Litecoin. The deal also comes with an option to increase this interest to 100% for a period of two years after the completion of the transaction. Despite all these positive sentiments, Litecoin continued falling and remained flat throughout Tuesday.

Daily Technical Levels
Support Resistance
257.190 269.463
253.099 277.645
244.917 281.736
Pivot point: 265.372
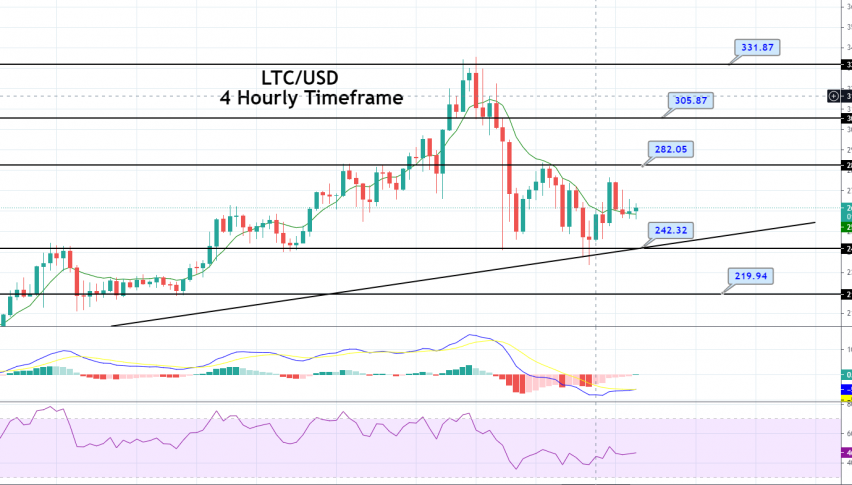
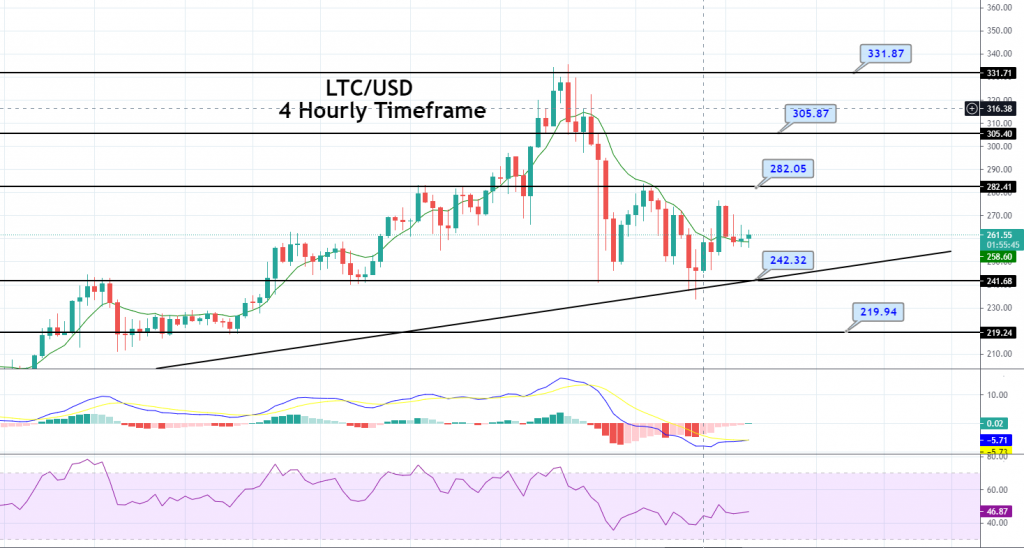
On the technical front, the LTC/USD pair is consolidating in a narrow trading range of 282 – 242. Violation of this range can direct further trends in the price. On the lower side, a bearish breakout of 242.32 level can lead the pair towards the support area of 219 level. Simultaneously, the breakout of the 282 level can lead Litecoin towards the 305 resistance level. The idea now is to stay bearish below 265 to target 242. Good luck!
LTC/USD
Arslan Butt
Lead Markets Analyst – Multi-Asset (FX, Commodities, Crypto)
Arslan Butt serves as the Lead Commodities and Indices Analyst, bringing a wealth of expertise to the field. With an MBA in Behavioral Finance and active progress towards a Ph.D., Arslan possesses a deep understanding of market dynamics.
His professional journey includes a significant role as a senior analyst at a leading brokerage firm, complementing his extensive experience as a market analyst and day trader. Adept in educating others, Arslan has a commendable track record as an instructor and public speaker.
His incisive analyses, particularly within the realms of cryptocurrency and forex markets, are showcased across esteemed financial publications such as ForexCrunch, InsideBitcoins, and EconomyWatch, solidifying his reputation in the financial community.
Related Articles