Litecoin Price Forecast – Downward Trendline Resistance, Brace for Sell!
LTC/USD closed at 259.830 after placing a high of 263.067 and a low of 243.842. After declining continuously for nine consecutive sessions
Written by:
Arslan Butt
•
Wednesday, April 28, 2021
•
2 min read
•
Last updated: Wednesday, April 28, 2021

LTC/USD closed at 259.830 after placing a high of 263.067 and a low of 243.842. After declining continuously for nine consecutive sessions, Litecoin posted the second day of gains on Tuesday. The recent spike likely followed the upward momentum in Bitcoin prices. BITCOIN remained on a positive note for the second day in the market amid a stockpile of positive news.
First, another U.S. bank – Bancorp, the fifth-largest in the country, announced to provide Bitcoin and other cryptocurrency exposure to its customers on increased demand from them. Second, Mastercard and Gemini also announced a new reward system for credit cards that are expected to pay cashback to its users in Bitcoin by almost 3%. Third, the company owned by billionaire Elon Musk, Tesla, reported record profits due to sales of emissions credits and speculative gains on Bitcoin. The rising prices of Bitcoin changed the market mood to bullish, and other altcoins like LTC/USD also followed it and increased their gains.
Furthermore, Litecoin founder Charlie Lee spoke on CNBC and explained the difference between Litecoin and Bitcoin. He repeated his previous comments on it being cheaper and faster. However, the fact that CNBC allowed Lee to promote his project to a mainstream audience also helped LTC/USD trade on a positive note on Tuesday.

LTC/USD Daily Technical levels
Support resistance
251.551 263.927
243.300 268.052
239.175 276.303
Pivot Point: 255.676
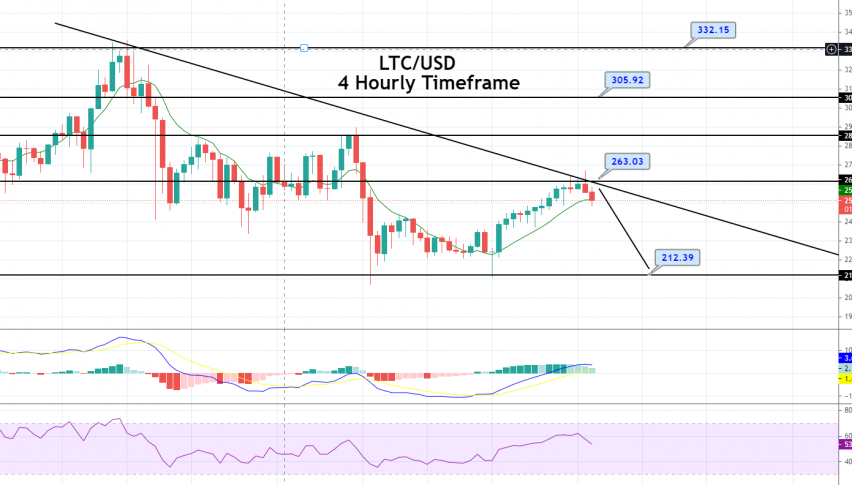
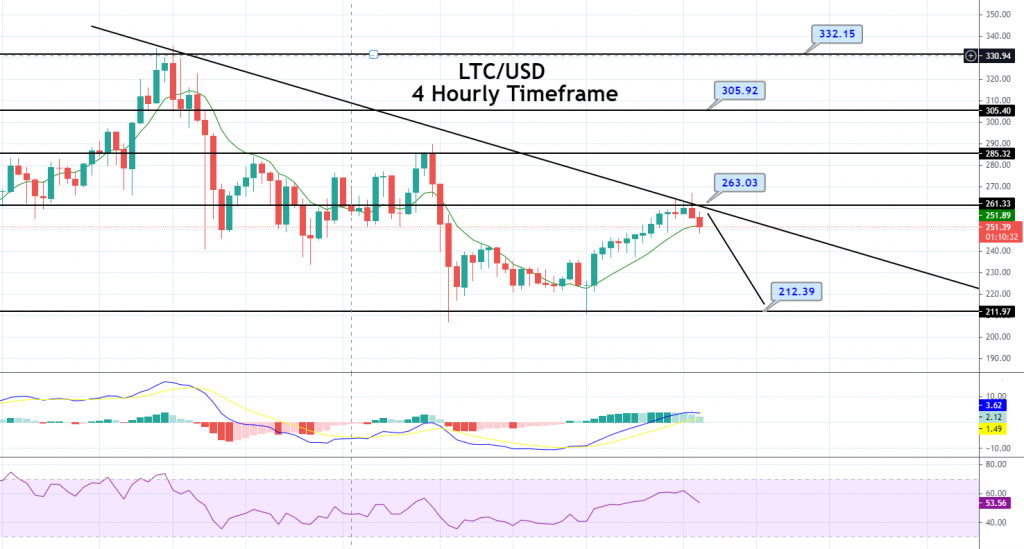
The LTC/USD pair is trading at 251 level, taking a bearish turn below a strong resistance area of 263. On the lower side, the pair has closed a shooting star candle that’s suggesting odds of bearish trend continuation. On the lower side, LTC can gain support around 230 and 212 levels. The MACD value is holding above 0 levels, but the recent histograms suggest bearish bias in the pair. At the same time, the pair is also crossing below 50 EMA on a 4-hour chart. Let’s consider taking a sell trade below 262 level today. Good luck!
Arslan Butt
Lead Markets Analyst – Multi-Asset (FX, Commodities, Crypto)
Arslan Butt serves as the Lead Commodities and Indices Analyst, bringing a wealth of expertise to the field. With an MBA in Behavioral Finance and active progress towards a Ph.D., Arslan possesses a deep understanding of market dynamics.
His professional journey includes a significant role as a senior analyst at a leading brokerage firm, complementing his extensive experience as a market analyst and day trader. Adept in educating others, Arslan has a commendable track record as an instructor and public speaker.
His incisive analyses, particularly within the realms of cryptocurrency and forex markets, are showcased across esteemed financial publications such as ForexCrunch, InsideBitcoins, and EconomyWatch, solidifying his reputation in the financial community.
Related Articles