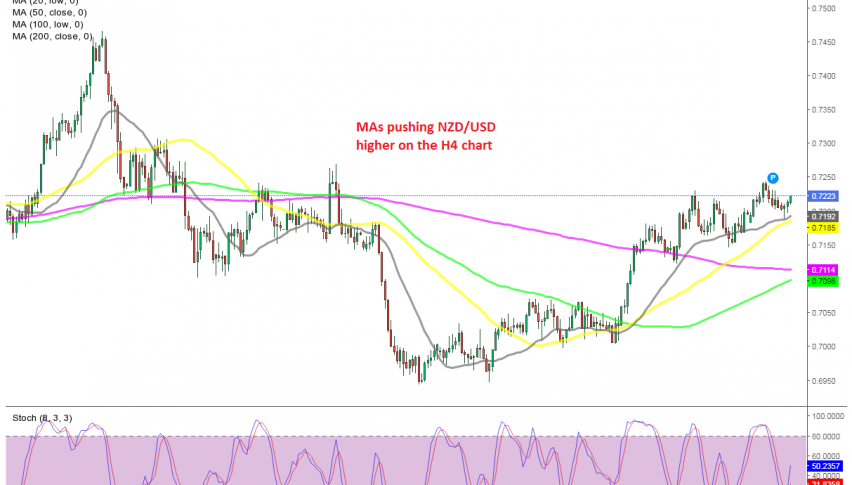
Moving Averages Still Holding As Support for NZD/USD
NZD/USD has reversed higher today, after bouncing off the MAs on the H4 chart

| (%) | ||
|
MARKETS TREND
The market trend factors in multiple indicators, including Simple Moving Average, Exponential Moving Average, Pivot Point, Bollinger Bands, Relative Strength Index, and Stochastic. |
The USD has been on a strong bearish trend since March last year, sending EUR/USD more than 15 cents higher during that time. Although, this pair reversed down after the first week of January, while NZD/USD kept going higher.
NZD/USD continued higher until the last week of February, increasing around 20 cents in total from last year’s lows. Although, during March this pair turned bearish as well, losing around 5 cents as it fell below 0.760.
This month the USD turned bearish again and this pair turned bullish. NZD/USD was finding resistance a the 100 SMA (green) on the H4 chart for some time, but it eventually pushed above that moving average and n ow the MAs have turned into support.
The 20 SMA (gray) and the 50 SMA (yellow) are providing support at the bottom, where we opened a buy forex signal yesterday during the retreat lower. The price formed a small hammer candlestick above them which is a bullish reversing signal after the retreat and today the price is b0uncing higher again. We are in profit with our NZD/USD signal, so we are holding on to this trade.
- Check out our free forex signals
- Follow the top economic events on FX Leaders economic calendar
- Trade better, discover more Forex Trading Strategies
- Open a FREE Trading Account


