Gold Can’t Keep Up Even When the USD Is Weak
Gold buyers have failed below $1.800 once again, as it turns bearish
Gold turned quite bearish in August last year, after being bullish for two years and reaching record highs above $2,000. Traditional safe havens lost their appeal, as cryptocurrencies earned that status, which sen Gold $400 lower until the end of March.
But, the USD decline during this month helped GOLD , which went through a decent retrace higher, after bouncing off the double bottom area around $1,675. Moving averages turned into support eventually as the price kept climbing higher.
Gold Live Chart
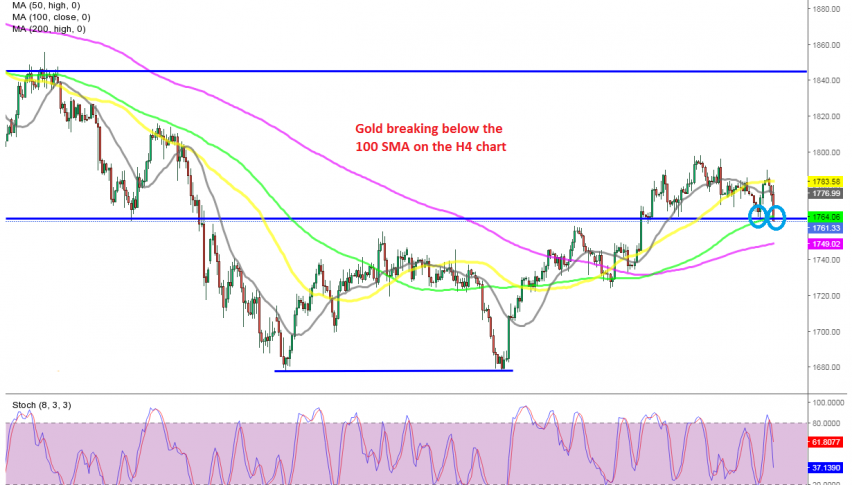
But, it seems like buyers have given up just below $1,800. Gold reversed below this level last week falling to the 100 SMA (green) on the H4 chart, which held well as support. Gold bounced off that moving average this week, but it reversed back down last night.
Buyers gave up below last week’s high, unable to retest the $1,8000 level, despite the USD turning weaker across the board this week, especially after the FED meeting last night. This shows that they are done with buying and now Gold has fallen nearly $30 lower, having pushed below the 100 SMA just a while ago.
Now sellers are in charge and it seems like the larger bearish trend will resume again, since Gold has completed the retrace higher on the daily chart. We will try to sell Gold if we see another retrace higher.
- Check out our free forex signals
- Follow the top economic events on FX Leaders economic calendar
- Trade better, discover more Forex Trading Strategies
- Open a FREE Trading Account


