Gold Remains Supported by MAs, But Faces Obstacles Above
Gold has turned bullish again today, attempting to break above $1,800
Gold turned bearish in August last year, after it made record highs that same month, above $2,000. During the decline moving averages were providing support, but they were broken and eventually Gold lost $400 from top to bottom.
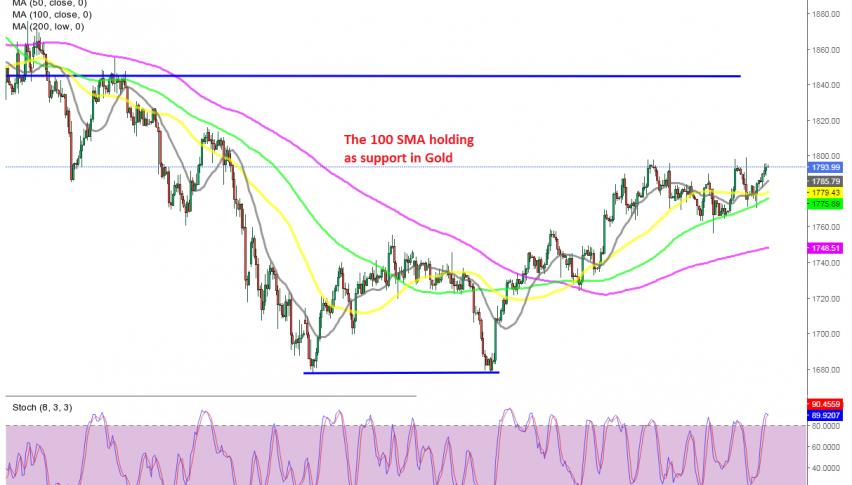
Although, Gold formed a double bottom at $1,675 which is the equivalent of the double top. The price bounced off that bottom and moved above the moving averages, which turned into support eventually on the H4 chart, particularly the 100 SMA (green).

Gold getting squeezed in a triangle
On the daily chart GOLD pushed above the 50 SMA (yellow) after finding resistance there for some time. The 20 SMA (gray) has turned into support at the bottom, while at the top buyers are facing the 100 SMA (green).
This moving averages has acted as support before and it turned into resistance in the last two weeks and might reverse the price down. But, the double bottom pattern suggests a move to $1,830, which is where the 200 SMA (purple) comes at.
So, there’s a strong chance that the retrace higher might stretch up there, which would be a good place to open a long term sell trade. But, the 100 SMA here looks tempting as well, particularly if the case for a bullish reversal in the USD strengthens in the coming days. So, we will follow the price action now to see if there will be a break of the 100 SMA soon.
- Check out our free forex signals
- Follow the top economic events on FX Leaders economic calendar
- Trade better, discover more Forex Trading Strategies
- Open a FREE Trading Account