Will the 200 SMA Keep Ripple XRP Supported or Will We See A Crash Down?
Ripple is trying to decide between MAs after yesterday's retreat
Cryptocurrencies have been extremely bullish during this year, as they keep making record highs. ETHEREUM pushed above $4,000 yesterday, while Litecoin which has become an Ethereum minion reached $420.
Although, the volatility remains extremely high as well. After every surge and a new record high, we have seen some deep pullbacks following. LITECOIN retreated around $90 lower yesterday to $330s, while Bitcoin fell to $53,500s from below $60,000.
This sort of price action indicates that cryptocurrencies have most likely hit a short-term top for the time being, and now we are seeing a pullback lower. There a chance that BITCOIN may challenge $40,000 in the coming days/weeks if it breaks below $50,000.
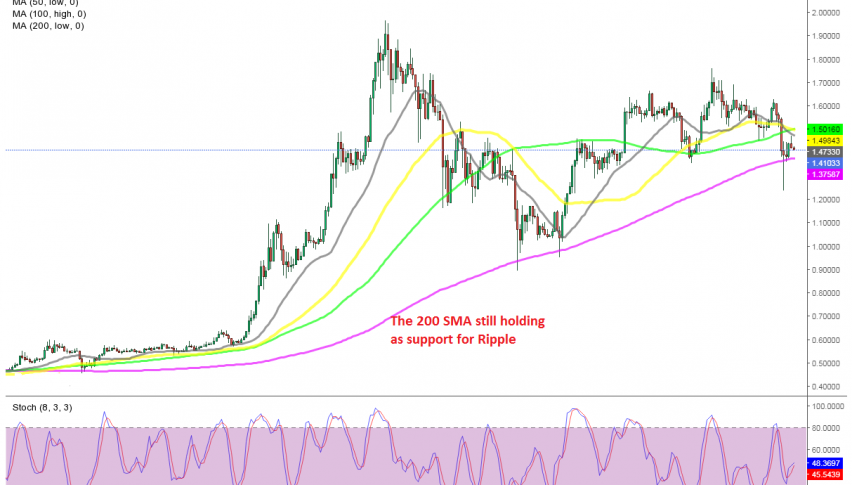
RIPPLE coin XRP also tumbled lower from around $1.63 to $1.23 yesterday, breaking below the 100 SMA (green) on the H4 chart, which was acting as support for this crypto on the H4 chart. But, the 200 SMA (purple) and turned into support again, after doing so twice in April, after the deep pullback.
This moving average was pierced briefly but the price pulled back up and the candlestick closed above it, so it wasn’t a proper break. This looks similar to the price action at the end of April, suggesting that we might see a bounce off the 200 SMA soon.
Although, the other moving averages are acting as resistance at the top now, rejecting Ripple. So, there’s also a chance that we might see a deeper retreat in Ripple, especially if Bitcoin breaks below $50,000. At he moment we are around $2,000 pips in profit on our buy XRP/USD signal and we are holding onto it.
- Check out our free forex signals
- Follow the top economic events on FX Leaders economic calendar
- Trade better, discover more Forex Trading Strategies
- Open a FREE Trading Account
- Read our latest reviews on: Avatrade, Exness, HFM and XM
Related Articles


Sidebar rates
Related Posts
