Crude Oil Finding Support at MAs, After the $5 Pullback
Crude Oil has stopped declining as MAs provide support
Crude Oil has been really bullish since it reversed from the abyss in April last year, when US WTI crude was trading at $-37. US Oil reached the highs at $68 in early March this year, although it retreated more than $10 down that month.
The 50 SMA held as support on the daily chart and crude Oil resumed the bullish trend once again, as the USD turned waker in April. The price moved above moving averages on the H4 chart, which turned into support, while it kept pushing higher.
Although, Oil was slow to push the highs higher during May, which was a bearish reversing sign, suggesting that buyers were running out of steam. The reversal came yesterday and crude Oil tumbled down from around $67 20 $62.
There were a few factors which turned the sentiment bearish for crude Oil. Crude oil entered a downward trajectory during the Asian session yesterday, as the prospects of the Joint Comprehensive Plan of Action nuclear deal weighed on the market. On the other hand, the American Petroleum Institute’s report of an unexpected crude inventory build and concerns over the progress of the coronavirus in Asia also souring sentiment.

The 50 SMA is still pushing WTI Oil higher
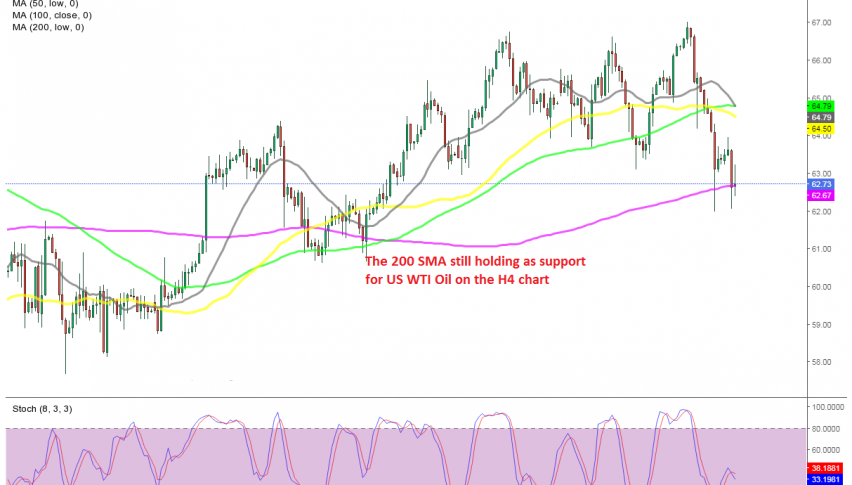
But, the 200 SMA (purple) held as support during the decline yesterday, while today it held again after a second attempt. Now Oil traders are trying to decide what to do at this moving averages. On the daily chart above the 50 SMA (yellow) continues to act as support as well. So, there’s a chance of a bullish reversal from here and we are trying to decide whether to go long. You can follow our signals page for live signals in crude Oil.
- Check out our free forex signals
- Follow the top economic events on FX Leaders economic calendar
- Trade better, discover more Forex Trading Strategies
- Open a FREE Trading Account


