Litecoin, Chainlink and Bitcoin Cash All Uncertain, Trading Between MAs
Cryptocurrencies are trying to make up their mind at the moment

| (%) | ||
|
MARKETS TREND
The market trend factors in multiple indicators, including Simple Moving Average, Exponential Moving Average, Pivot Point, Bollinger Bands, Relative Strength Index, and Stochastic. |
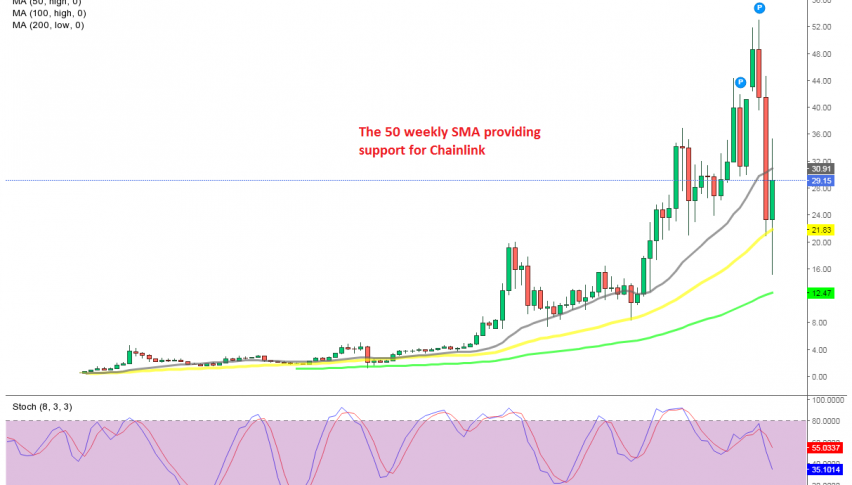
Cryptocurrencies stopped declining this week, after the crash we saw last week, which sent the crypto market crashing lower, with almost all cryptos losing more than half their value. Chainlink fell from around $53 to $15, which means losing around 70% of the value.
Sellers pushed below the 50 SMA (yellow) on the weekly chart, as shown above, but the candlestick didn’t close below it so it didn’t count as a break. This week the price bounced off the 50 SMA and buyers pushed it above the 20 weekly SMA (gray), but they couldn’t hold on to gains and the price has slipped below it once again. So, LINK/USD is trading between the 50 weekly SMA at the bottom and the 20 SMA at the top.

BCH/USD reversing from the 100 daily SMA today
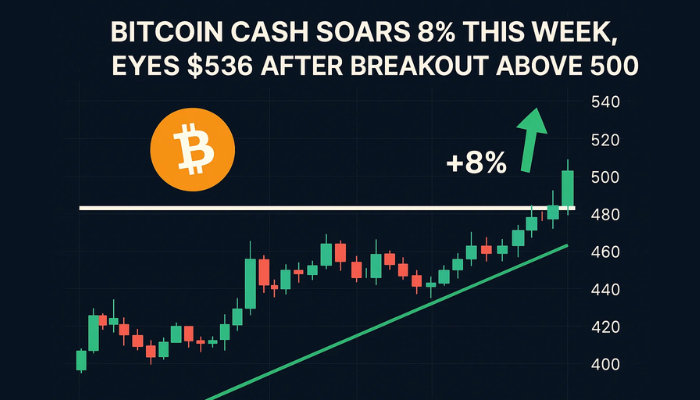
Looking at the Bitcoin Cash chart, we see that here it was the 200 SMA (purple) which held as support, despite being pierced. Although, this is the daily chart. BCH/USD bounced off that moving average but the 100 SMA (green) at the top turned into resistance, rejecting the price twice and now Bitcoin Cash is heading down again.

The 200 SMA still holding as support for Litecoin today
Litecoin also fell below the 200 SMA on the daily chart and it actually broke below that moving average, but the reversal came this week and LTC/USD is also trading between the 100 MA at the top and the 200 SMA at the bottom now as well. The bullish momentum this week has been weak compared to the pace of the crash and now the bullish reversal is in question.
Cryptocurrencies seem uncertain what direction to take now, after the bullish momentum faded. But, I assume that we won’t see anymore major declines like the one we saw last week, since Bitcoin miners in China are moving abroad and continuing their operations.
- Check out our free forex signals
- Follow the top economic events on FX Leaders economic calendar
- Trade better, discover more Forex Trading Strategies
- Open a FREE Trading Account


