The Bullish Trend Will Resume in Litecoin, Once the 20 Weekly SMA Breaks
Litecoin has tried to turn bul;lish again, but the 20 SMAs are keeping it down on the weekly chart
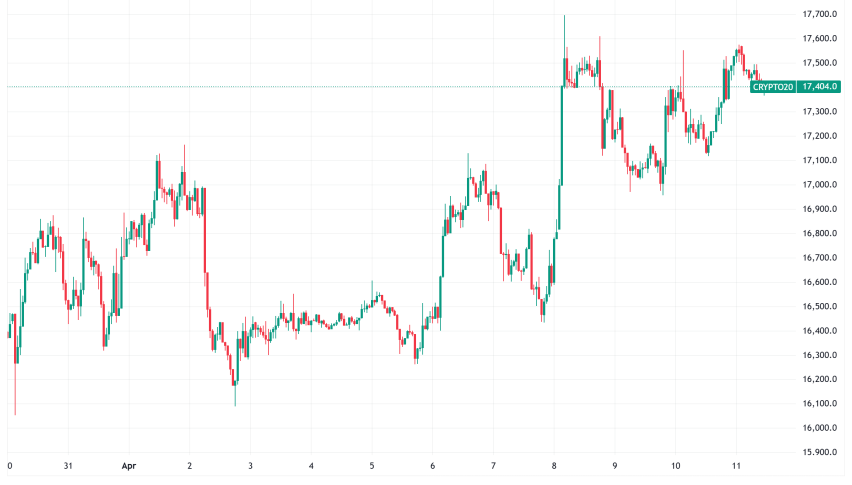
Cryptocurrencies have been trying to turn bullish again since the crash in May, but they have failed to resume the larger bullish trend. We have seen several attempts from buyers, but they have all failed and the sentiment remains neutral, with the uncertainty continuing.
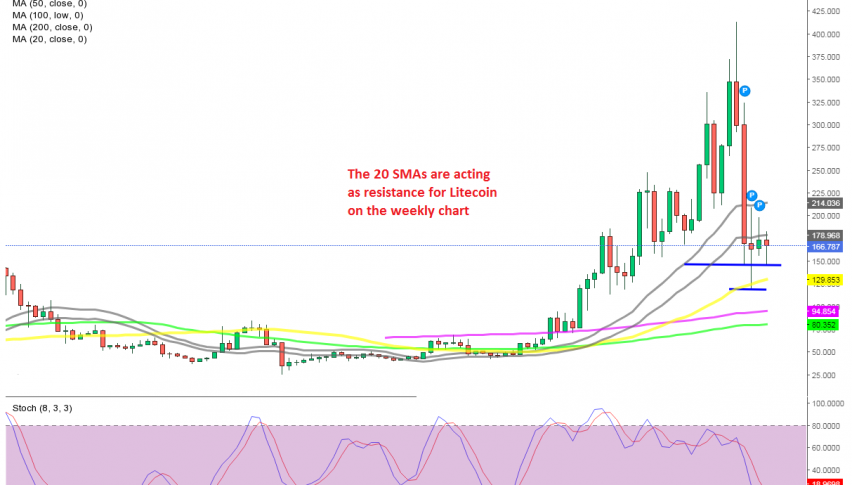
Litecoin found solid support at the 50 SMA (yellow) on the weekly chart, bouncing higher off that moving average. But, the two 20 SMA (green) indicators have been acting as resistance at the top, stopping buyers from resuming the bullish trend.
Litecoin
The close 20 SMA which is the one above, stopped the first bounce, while the low 20 SMA has been keeping the price subdued on the weekly chart. So, LITECOIN remains below these moving averages which have become the ultimate resistance, so the bullish trend will resume once these moving averages are broken. For now, let’s follow the price action and see when the break will come, since we are already long on LTC/USD from back in March.
- Check out our free forex signals
- Follow the top economic events on FX Leaders economic calendar
- Trade better, discover more Forex Trading Strategies
- Open a FREE Trading Account
- Read our latest reviews on: Avatrade, Exness, HFM and XM
Related Articles
Sidebar rates
Related Posts
