Polkadot to Break Out of the Triangle Soon?
Let's See Where Polkadot Ends Up After Failing at the 200 SMA

Polkadot turned bullish this year as most cryptocurrencies did, following the positive sentiment in the crypto market. As a result, DOT/USD increased from $5 at the end of December, to almost $50 by the middle of May.
Most of the cryptocurrencies stagnated from April to March or stared to pull back down, but Polkadot was on the group of cryptos which were still pushing higher until the middle of last month. That was a bullish sing for Polkadot, but it couldn’t evitate the major crash in this market in the second half of May.
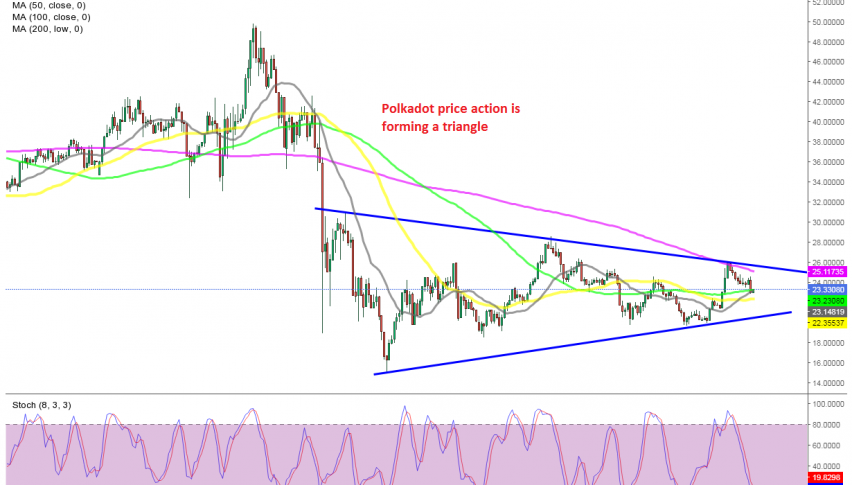
The price fell below $14 but it stopped there and DOT/USD has been trading sideways, in a narrowing range, which looks increasingly like a triangle. The highs are getting lower and yesterday this crypto reversed down from the 200 SMA (purple) on the H4 chart.
This moving average turned into resistance but the 100 SMA which was acting as support before might do the same again now since the decline has stalled there for several hours. If it holds, then we will probably see another bounce and the 200 SMA together with the descending trendline might be in danger.
We are already long and in profit in Polkadot, so we are holding on to our DOT forex signal, especially since there are some developments for Polkadot. The Kusama parachain slot auctions began, with a Polkadot and Kusama governance platform — the Kusama council on Tuesday passed the Motion 310 signaling the start of parachain slot auctions.
- Check out our free forex signals
- Follow the top economic events on FX Leaders economic calendar
- Trade better, discover more Forex Trading Strategies
- Open a FREE Trading Account


