MAs Have Held as Support for Litecoin on the Weekly Chart
Litecoin has pulled back up after findng support at he 100 and 200 SMAs on the weekly chart
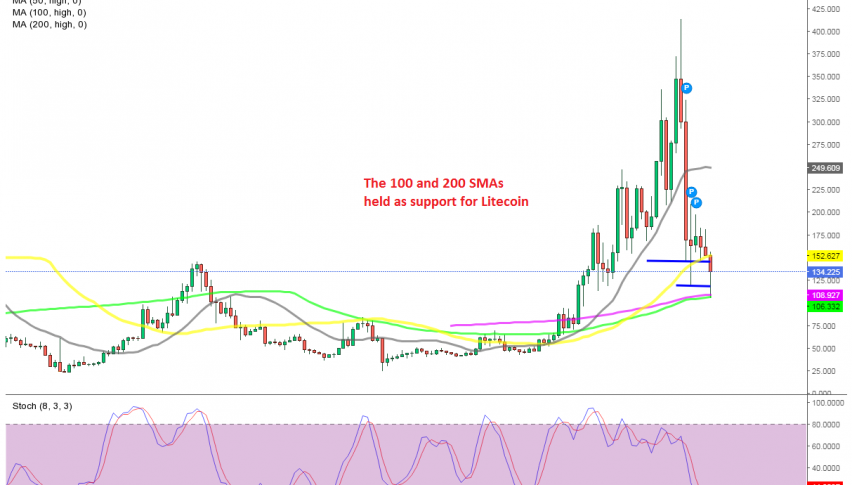
Moving averages have been doing a good job, acting as support and resistance for cryptocurrencies, turning into support when the price was bullish and vice versa. We can see from the Litecoin weekly chart that during most of last year, moving averages have been acting as resistance, particularly the 50 SMA (yellow) and the 100 SMA (green).
Then the price turned bullish, pushing above the moving averages, and the 20 SMA (gray) turned into support. The trend was really strong, so the other moving averages weren’t able to catch up with the price, therefore the 20 SMA kept pushing the LTC/USD higher.
Unfortunately, the crash came in May and the 20 SMA was broken without much resistance, as mentioned in our 2021 Litecoin forecast. The 50 SMA (yellow) offered support for about a month, but it was broken this week, with the selloff in cryptos resuming again.
But, the last two moving averages held as support for Litecoin, and the price has pulled back up now.The 100 SMA (green) and the 200 SMA (purple) held during the decline this week, and if Litecoin were to climb up to $140 by the end of the week, the chart setup would look quite bullish. But, we will have to wait and see.
- Check out our free forex signals
- Follow the top economic events on FX Leaders economic calendar
- Trade better, discover more Forex Trading Strategies
- Open a FREE Trading Account