Polkadot (DOT) Among the Bigger Losers in Crypto Market: What’s Happening?
Polkadot (DOT) is turning out to be one of the biggest losers on Thursday, suffering under the bearish mood affecting the wider crypto
Polkadot (DOT) is turning out to be one of the biggest losers on Thursday, suffering under the bearish mood affecting the wider crypto sector after Bitcoin (BTC) tumbles below the $32,000 mark. At the time of writing, DOT/USD is trading around $13.
Over the past week, Polkadot has been experiencing sideways trading action amid low volatility as investors remain wary about the high risk digital currencies’ space. The latest downbeat sentiment is the result of a fresh bout of strength in the US dollar over rising expectations for the Fed to hike interest rates and tighten its monetary policy sooner than anticipated.
Over the past 24 hours, Polkadot has lost nearly 9% of its value and is down by over 34% over the past month. Despite recent gains every now and then on account of the parachain auctions, the dominant theme remains bearish as traders turn wary about digital assets in the wake of recent regulatory developments around the world.
On the fundamentals front, however, there are several promising developments that can lend support to DOT in the near future, keeping in line with our previous forecast. With parachain auctions already underway on Polkadot’s canary network Kusama, it is only a matter of time before they begin on DOT’s blockchain as well, ushering in a new wave of interoperability for projects on the ecosystem.
Moonriver, one of the projects that won a slot in the Kusama parachain auctions, successfully finished the first part of its launch process, producing its first blocks. Kusama recently completed its fourth round of auctions with a bid of 130,000 KSM, indicating significant interest in the concept. Once parachains make their way to Polkadot, the value of DOT is likely to head up high in the coming months.
Key Levels to Watch
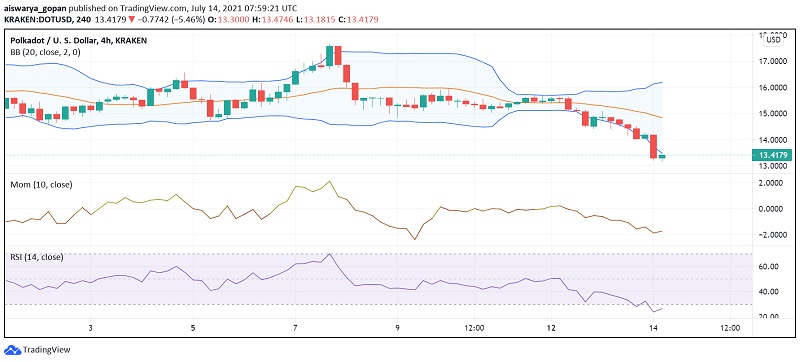
On the 4-hour chart of DOT/USD, moving averages are supporting a bearish bias prevalent in the market. Although, leading technical indicators RSI and momentum exhibit some interest building up among buyers as well.
Polkadot’s price is sitting not only under the pivot point at $15 but has also dropped below the first support level at $14. It looks like it’s ready to test the next support at around the $13 level, and possibly head lower towards the key $10 level where it could find some more support.
On the other hand, if buying interest strengthens, a bullish mood can be confirmed once the price makes its way back above the pivot point and tests resistance at $17.
- Check out our free forex signals
- Follow the top economic events on FX Leaders economic calendar
- Trade better, discover more Forex Trading Strategies
- Open a FREE Trading Account