Uncertainty Keeps Gold Bouncing Between MAs in all Charts, Until the Breakout That’s Coming Soon
Gold is about to make a move in either direction, as the range between MAs gets narrower
Gold has been quite volatile since the coronavirus breakout last year. It turned bullish from March until August, gaining more than $600 as the uncertainty sent safe havens surging higher. But, traders realized that the world wasn’t going to end because of the coronavirus, and the sentiment improved somewhat, especially during the summer, as the world reopened from lock-downs.
Gold Live Chart
As a result, safe havens turned bearish, with cryptocurrencies also entering this market in a major party that lasted until May this year. As we highlighted in our 2021 Gold forecast, gold retreated by $400, from $2,075 to $1,675 by the end of March, but as restrictions continued well into spring in Europe and North America, the sentiment turned negative again in financial markets and gold turned bullish, helped by the period of weakness in the USD during Q2.
Gold Technical Analysis – XAU/USD Daily, Weekly and H4 Charts
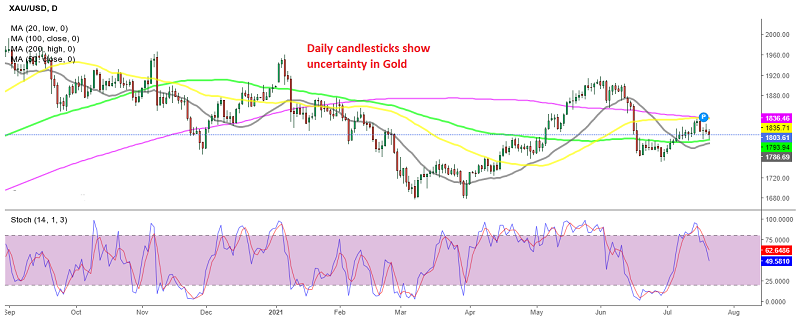
In June, Gold climbed higher again, moving above $1,800, but this time the 200 SMA (purple) stopped the climb. Prior to that, gold ignored all moving averages, moving above and below them. Now, it seems like gold is stuck between moving averages, which are keeping it within a range.
The top is provided by the 200 SMA (purple), while the bottom is held in place by the 100 SMA (green). The daily candlesticks, which have closed as dojis and pins, show uncertainty, with one side taking the lead, only for the other side to push back down and close where the day started.

Gold getting squeezed between 2 MAs, with a breakout expected soon
On the weekly chart above, the 50 SMA (yellow) was providing support until the middle of February, then the 100 SMA (green) took over that job. We have seen gold increase over the past few days, but the bullish momentum seems to be fading, since the gains have been getting smaller in the last few days.

The support is holding around $1,895
On the H4 time-frame, the XAU/USD seems stuck within a range as well, with the 200 SMA at the top and the 100 SMA at the bottom. Although, here we can spot a support level around $1,895. This area was acting as support during June, while in July it turned into support, as gold started to move higher.
This confirms the uncertainty right now, since the global economy is expanding pretty fast, while the rumours about coming restrictions for the new COVID variant are keeping traders and investors on their toes. So, both sides are at risk now, and the range is getting closer on the H4 chart, as moving averages come nearer.
- Check out our free forex signals
- Follow the top economic events on FX Leaders economic calendar
- Trade better, discover more Forex Trading Strategies
- Open a FREE Trading Account
- Read our latest reviews on: Avatrade, Exness, HFM and XM
Related Articles


Sidebar rates
Related Posts
