Core PCE Price Index Flat, EUR/USD Pares Weekly Gains
July was a whipsaw period for the EUR/USD. Subsequently, a bulk of the month’s trading volume occurred between 1.1900 and 1.1750.

The Greenback is on the march today, following a flat reading on June’s Core PCE Price Index. The Core PCE Price Index is a smoothed measure of the prices paid by consumers for goods and services. It’s a key tool of the Fed that is used to measure inflationary trends. And, although today’s figures came in as expected, the EUR/USD is seeing significant bearish action.
Here is a quick look at the highlights of this morning’s U.S. economic reports:
Event Actual Projected Previous
Core PCE Price Index (June, YoY) 3.5% 3.7% 3.4%
Core PCE Price Index (June, MoM) 0.4% 0.6% 0.5%
Personal Income (MoM, June) 0.1% -0.3% -2.2%
Personal Spending (MoM, June) 1.0% 0.7% -0.1%
The overriding theme of this group of stats is inflation. Incomes, spending, and prices are all on the rise. However, the Core PCE Price Index did fall month-over-month and disappointed expectations on a year-over-year basis. So, while these numbers suggest inflation, they also signal that price appreciation isn’t out of control — yet.
For the EUR/USD, rates are off by -0.20% for the session. Let’s dig into the weekly technicals and see if we can spot a trade or two.
EUR/USD Rejects The 1.1900 Handle
July was a whipsaw month for the EUR/USD. After June’s epic plunge, forex traders took a modest tone toward the pair. Subsequently, a bulk of the month’s trading volume occurred between 1.1900 and 1.1750.
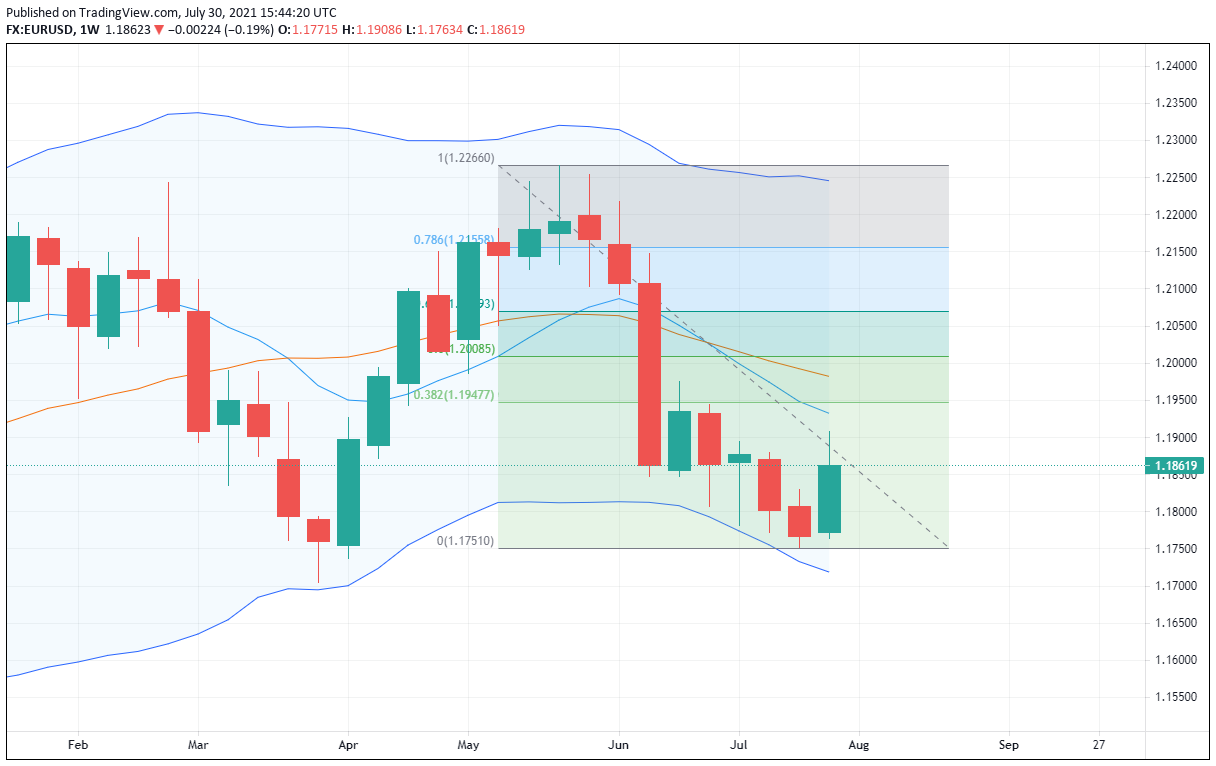
Here are two levels to watch as we head toward August’s trade:
- Resistance(1): Weekly SMA, 1.1931
- Resistance(2): 38% Fibonacci Retracement, 1.1947
Bottom Line: Early August is likely to be an active time for the EUR/USD. With the July Fed meeting out of the way, buyers and sellers will be free to take new positions in the pair without worry of central banking intervention. Given the timing, it will come as no surprise if forex players drive the EUR/USD to a test of topside resistance near 1.1947.
As long as the current weekly Swing Low (1.1751) remains valid, I’ll have sell orders in queue from 1.1939. With an initial stop loss at 1.1979, this trade produces 40 pips on a standard 1:1 risk vs reward management plan.
- Check out our free forex signals
- Follow the top economic events on FX Leaders economic calendar
- Trade better, discover more Forex Trading Strategies
- Open a FREE Trading Account
- Read our latest reviews on: Avatrade, Exness, HFM and XM
Related Articles


Sidebar rates
Related Posts
