Cosmos (ATOM/USD) Breaches Resistance at 16.70. Buy a Retreat to Support

The crypto token, Cosmos, rose from a low of around 15.0 on August 18, to surge past the resistance at 16.70 the same day. At the time of writing, the ATOM/USD was trading at around 18.35, after retreating from the high of 20.4 it reached on August 19.
What Fueled the Bullish Momentum in ATOM/USD?
Cosmos claims to address some of the most pressing challenges in the blockchain industry. It aims to improve the slow, unscalable, expensive and environmentally harmful protocols, by availing an ecosystem that connects different blockchains. On its website, Cosmos refers to itself as the “Internet of Blockchains.”
Living by its own hype is the reason behind the stellar rise in ATOM/USD. On August 17, Medium.com reported that Cosmos would integrate with InterBTC. By welcoming InterBTC into its network, Cosmos brings deep BTC liquidity to its users. InterBTC is itself a DeFi product with features of interoperability that facilitate information movement from one blockchain to another.
News of the upcoming addition of InterBTC, which is pioneered by Interlay, boosted confidence among Cosmos users, helping ATOM/USD to surge.
The breach of the resistance level at 16.5 opens further opportunities for buyers, with this area now having become an important support.
ATOM/USD – A Technical Outlook
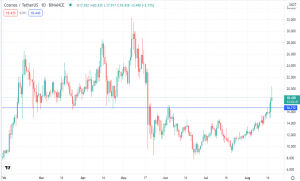
Cosmos Daily Chart Analysis
Looking at the daily chart above, it can be seen that ATOM/USD is retreating back to the new-found support. Potential upsides from the support of 16.5 are highly likely, based on the fundamental developments and technical pointers. We are keen to watch the price action behavior at the support for potential buy trades.
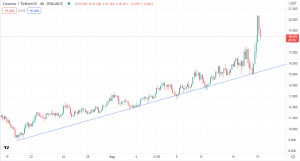
ATOM/USD 4-Hour Chart Analysis
From the 4-hour chart, it can be seen that ATOM/USD has been on a clear uptrend. It has been forming higher highs and higher lows since July 21. Recent price surge in the last 24 hours only extended the previous bullish momentum.
ATOM/USD Trade Analysis and Idea
We continue to hold a bullish view, based on ATOM/USD. However, I advise that we wait for the price to retreat back to the support area of 16.5 on the daily chart and/or to the ascending trendline on the 4-hour chart. Price retreats to these levels will give us a chance to enter a trade with a better risk-reward ratio.
For a buy trade, I will aim for the 21.5 level as my first take profit, because in the past, ATOM/USD has shown some indecision to the upside.
My second take profit point will be at 24.0, which has also acted as an important market event area.
I will put my stop-loss at around 14.8, the point just below the breakout candle, where ATOM/USD breached the resistance area.
- Check out our free forex signals
- Follow the top economic events on FX Leaders economic calendar
- Trade better, discover more Forex Trading Strategies
- Open a FREE Trading Account
- Read our latest reviews on: Avatrade, Exness, HFM and XM
Related Articles


Sidebar rates
Related Posts
