COSMOS (ATOM) to the Moon? Not so fast.
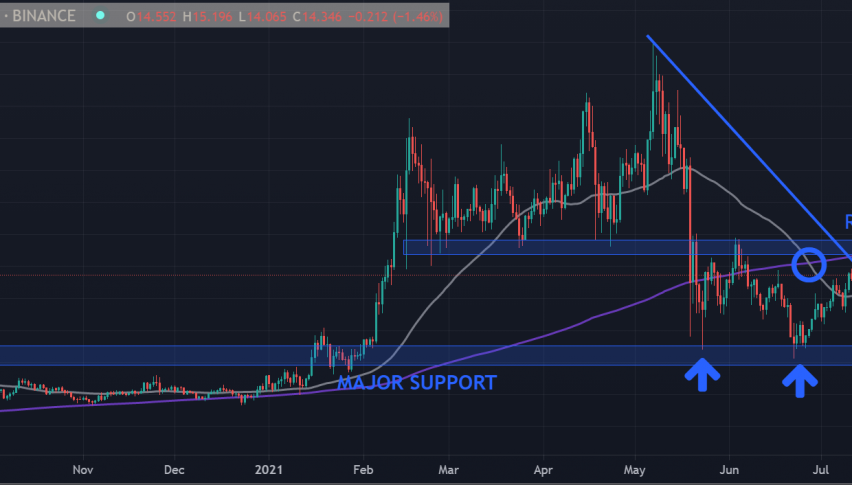
*ATOM: Daily Timeframe, has bounced above the major support level again
ATOM broke above a multi-year resistance area of 7.50 to 8.80 early this year and surged to all-time highs of 32.32 in May 2021, which represents a gain of more than 200% in just a few months. Since then, ATOM has fallen back to this previous resistance area that has now turned into support. Since the crypto crash of this year, it has bounced above this major support level at least four times in the past three months.
Major support level: 8.00 to 9.00. ATOM has bounced at least four times upon reaching this area.
| Bounce Low | Rally Peak | Low to Peak | Bounce | |
| # | Date Price | Date Price | % Gain | Duration (days) |
| 1 | May 19 9.551 | May 21 17.561 | 84% | 2 |
| 2 | May 23 8.51 | June 3 17.2 | 102% | 11 |
| 3 | Jun 22 7.83 | Jul 11 14.8 | 89% | 19 |
| *4 | Jul 20 8.93 | Aug 11 15.456 | 73% | 22 |
*Fourth bounce: Jul 20 to Aug 11 not yet completed. Could still move upwards in the short term.
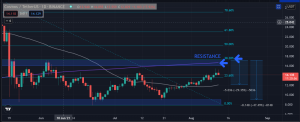
Since then, ATOM has rallied, and it now looks like it is headed towards its immediate resistance of 16.00 to 17.00. This time around, by coincidence, it is reinforced by a key dynamic long-term 200-day moving average and the 38.20% Fibonacci retracement level.
Watch and observe how ATOM moves when it reaches this resistance area. My bias is that short-term traders will try to cash out and take profits in this area. Selling pressure was observed in the months of May, June and July when ATOM tried to rally above it, but failed.
The overall midterm trend for ATOM is still downward, as it has also formed a bearish death cross pattern, although the price action would suggest that it may continue to consolidate within the range of its major support and resistance area of 8.00 to 17.00. Its ADX is now also only 20, which reinforces the idea that the downward selling pressure may have weakened, but at the same time, buying pressure may not be strong enough to break above the resistance area. In this regard, I believe that ATOM will move within this box and consolidate for several months before moving higher and rallying, maybe late this year.
ATOM Trade Idea: Short Resistance levels
The longer-term trend of ATOM is still mainly bearish to neutral, and as such, I believe most rallies from the support levels will be unsustainable. Short ATOM in tranches at key resistance levels, such as the 200-day moving average and psychological resistance whole numbers: 15.00, 16.00, 17.00. Put the stop loss at 18.00, with a target price range of 12.00 down to 8.00 (which is the support range). Risk only 0.25 per tranche. This trade idea is negated if ATOM rallies further and breaks above the key resistance area.
Trade Summary:
Short: In tranches from 15, 16 and 17 resistance levels
Target Price:
Short term TP: 12.00
Mid-term TP: 10.00 to 9.00
Stop Loss: 18.00 (this means a rally above the resistance level)
VAR: Risk only 0.25 per tranche or even less.
ATOM is currently the 39th largest cryptocurrency, with a market capitalization of $271 Million.
- Check out our free forex signals
- Follow the top economic events on FX Leaders economic calendar
- Trade better, discover more Forex Trading Strategies
- Open a FREE Trading Account
- Read our latest reviews on: Avatrade, Exness, HFM and XM
Related Articles


Sidebar rates
Related Posts
