Gold Slips Below Intraday Pivot Point 1,795 – Who’s up for a Sell?
The precious metal gold closed at $1803.75 after reaching a high of $1812.05 and a low of $1802.65. Gold advanced on Tuesday
Written by:
Arslan Butt
•
Wednesday, August 25, 2021
•
3 min read
•
Last updated: Wednesday, August 25, 2021
- US Dollar Index, which measures the value of the greenback against six major currencies, fell on Tuesday.
- The rising spread of the Delta variant increases doubts about economic growth.
- On the upside, a break of the 1,806 barrier level might push gold prices towards the 1,815 figure.
Good morning fellas,
The precious metal, GOLD, closed at $1,803.75, after reaching a high of $1,812.05, and a low of $1,802.65. On Tuesday, during the first trading hours, gold advanced to its highest level since August 5, amid the declining price of the US dollar. However, the yellow metal failed to retain its bullish trend and turned red for the day, after losing all of its early gains. The US Dollar Index, which measures the value of the greenback against six major currencies, fell on Tuesday, extending its losses for the third consecutive session, and sinking to 92.81. This weighed heavily on the greenback. On the other hand, the US Treasury Yield on the benchmark 10-year note surged on Tuesday, reaching 1.299%. This pushed the greenback higher for the day and kept the yellow metal under pressure.
The range-bound movement of yellow metal on Tuesday could be attributed to the rising concerns of investors who believe that the surging numbers of coronavirus cases, due to the virulent Delta variant, might cause the US Federal Reserve to refrain from announcing its plans to taper its economic support, during the upcoming Jackson Hole symposium. The continuous spread of the Delta variant has strengthened doubts about economic growth and caused investors to anticipate that the US Federal Reserve could delay tapering, and these hopes kept the yellow metal under pressure on Tuesday. Gold tends to rise due to stimulus spending, on the back of its status as a hedge against inflation risks and currency weakness. However, the prices of gold have been caught between mixed signals from Fed officials regarding the tapering of economic support.
Meanwhile, the prices of the precious metal remained above the $1,800 level on Tuesday, and the fact that gold did not fall below this level showed that the market was still concerned about the rapid spread of the Delta variant, which supported the yellow metal as a safe haven asset.
Weaker Richmond Manufacturing Index Weighs on the Dollar
On the data front, at 18:59 GMT, the Richmond Manufacturing Index for August came in, showing a drop to 9, against the forecast of 25. This weighed on the US dollar, and caused further losses in the gold prices. At 19:00 GMT, the new home sales for July were released, indicating a surge to 708K, against the projected 698K, supported the US dollar, which added to the further decline in precious metals.
The data from August showed signs of slow growth in the US economy, adding to the growing investor concerns that the Fed might not announce plans for tapering economic support during the Jackson Hole symposium, which is scheduled for Friday.
The reason behind the poorer-than-expected US macroeconomic data could be the rising spread of the coronavirus, due to the Delta variant, and the impact it is having on society.
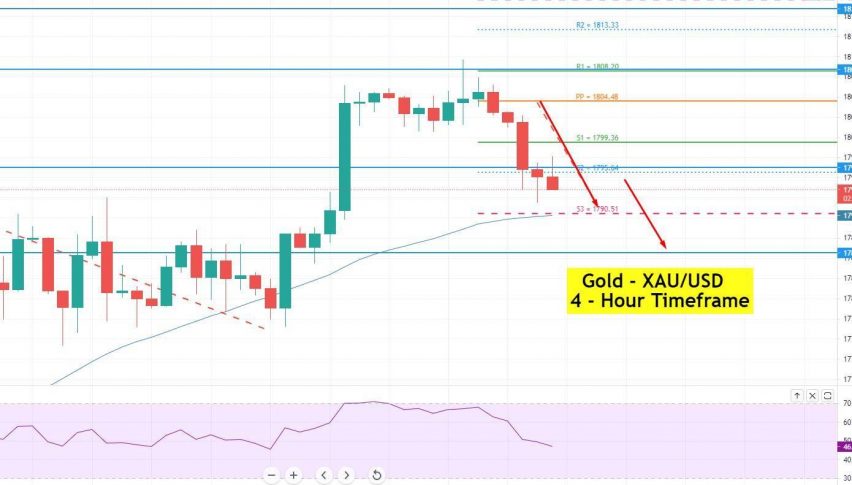
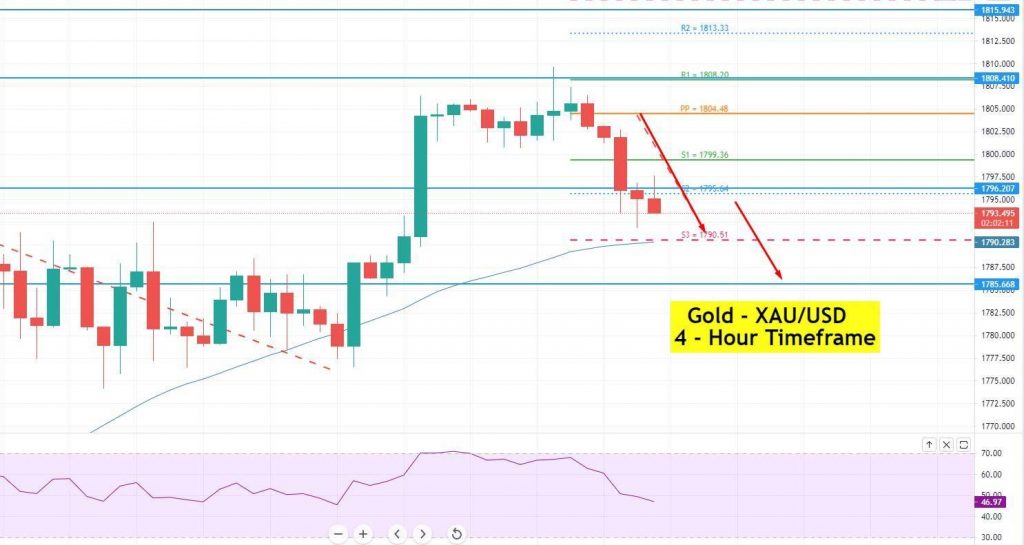
Gold Technical Analysis – Pivot Point Breakout
After testing the 1,793 support level, gold is trading with a downward bias at around 1,796. The pivot point support mark of 1,796 on the 4-hour timeframe has been violated, exposing the gold prices to the next support level of 1,793.

Daily Technical Levels
Support Resistance
1,800.25 1,809.65
1,796.75 1,815.55
1,790.85 1,819.05
Pivot Point: 1,806.15
On the downside, a breach of the 50 percent
Fibonacci retracement level might extend the selling tendency even further, to the 64.8 percent Fibonacci retracement mark of 1,789. On the upside, a break of the 1,806 barrier level might push the
GOLD prices towards the 1,815 mark, with the 1,825 level serving as the next resistance. The
RSI is still in negative territory. As a result, a breach of 1,793 might result in further selling in gold. The core durable goods orders will continue to be the key focus. Good luck!
Arslan Butt
Lead Markets Analyst – Multi-Asset (FX, Commodities, Crypto)
Arslan Butt serves as the Lead Commodities and Indices Analyst, bringing a wealth of expertise to the field. With an MBA in Behavioral Finance and active progress towards a Ph.D., Arslan possesses a deep understanding of market dynamics.
His professional journey includes a significant role as a senior analyst at a leading brokerage firm, complementing his extensive experience as a market analyst and day trader. Adept in educating others, Arslan has a commendable track record as an instructor and public speaker.
His incisive analyses, particularly within the realms of cryptocurrency and forex markets, are showcased across esteemed financial publications such as ForexCrunch, InsideBitcoins, and EconomyWatch, solidifying his reputation in the financial community.
Related Articles