Do Candlesticks Work in Cryptocurrencies?
Candlesticks are great trading indicators in traditional markets, but do they work in the crypto market?
Candlesticks are useful tools/indicators when trading in financial markets. I use them extensively, since they are good for predicting reversals. They make for great trading strategies when applied together with other indicators, such as support and resistance zones, moving averages and trendlines. But, the problem in the cryptocurrency market is that this market is active 24/7 and never stops.
Does anyone know what the daily closing price of Bitcoin is? It simply doesn’t have one. This means there are no daily or weekly opening or closing levels and the day or week closes differently all over the world, depending on the timeframe that your broker uses. People on the other side of the globe have a different daily or weekly closing price for cryptocurrencies.
Despite this, candlestick patterns still work quite well in the crypto market too. Below we will have a look at the main cryptocurrencies to see whether the candlestick patterns have worked and how well they have predicted the future direction of these cryptos.
Bitcoin H1 Chart Patterns

Bitcoin forming 3 bullish reversing signals
As shown on the Bitcoin chart above, we have Bitcoin trading on a bullish trend. On the first occasion, BTC/USD retreated lower, to the 100 SMA (green), where it formed a pin candlestick, which is a bullish reversing signal after the pullback. It didn’t take long before Bitcoin turned bullish again. That’s a great buying strategy as mentioned above.
On the second occasion, we have a pin, followed by a morning star, which reinforced the bullish reversing signal after the price had fallen below the moving averages. The bullish trend resumed again after those candlesticks. On the last occasion, we have a morning star right above the resistance level, which turned into support. That’s another great trading strategy indicating a buying opportunity.
Bitcoin Daily Chart Patterns

Candlesticks work well, even counter-trend
On the BITCOIN daily chart, we have many trading opportunities, as indicated by the candlestick patterns. In the first three patterns, we have more than one candlestick showing the future direction, which is an even stronger trading signal, as already mentioned. We even had candlesticks predicting a bearish pullback when the trend was bullish, which worked out fine. So, candlesticks can indicate trades, even against the trend, so they are really strong indicators.
Ethereum Daily Chart Patterns

On the ETHEREUM daily chart, the candlestick trading patterns have been quite clear. In the first case, we have a doji and a pin right at the previous low after the crash, which turned into a support level. Mixing support and resistance levels with candlesticks is a great trading strategy, as are moving averages with candlesticks, as shown in the second case, when Ethereum reversed lower after an upside-down/inverted pin.
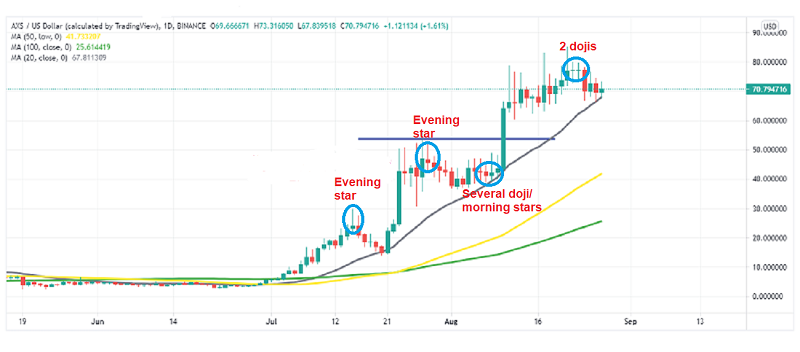
In the third case, the reversal takes place after a hammer above the support, while on the last occasion the reversal takes place at the 20 SMA (gray), after retreating lower during an uptrend. Candlestick formations have also indicated some great trading opportunities on the Axie Infinity token, as shown in the first image of this article. Signals have been both with the trend and against it, and they all have worked pretty well. But, also with the 20 SMA (gray), the profits were extraordinary, if you made use of them as we did a couple of times.
Etheruem Live Chart
- Check out our free forex signals
- Follow the top economic events on FX Leaders economic calendar
- Trade better, discover more Forex Trading Strategies
- Open a FREE Trading Account
- Read our latest reviews on: Avatrade, Exness, HFM and XM
Related Articles


Sidebar rates
Related Posts
