Why Everyone is Watching Solana (SOL) Despite Flat Movement

Flattish trading in *Solana (SOL) over the past few weeks
Breakout traders are watching Solana very, very closely nowadays, as it tightens and coils further and further. Here’s why:
-
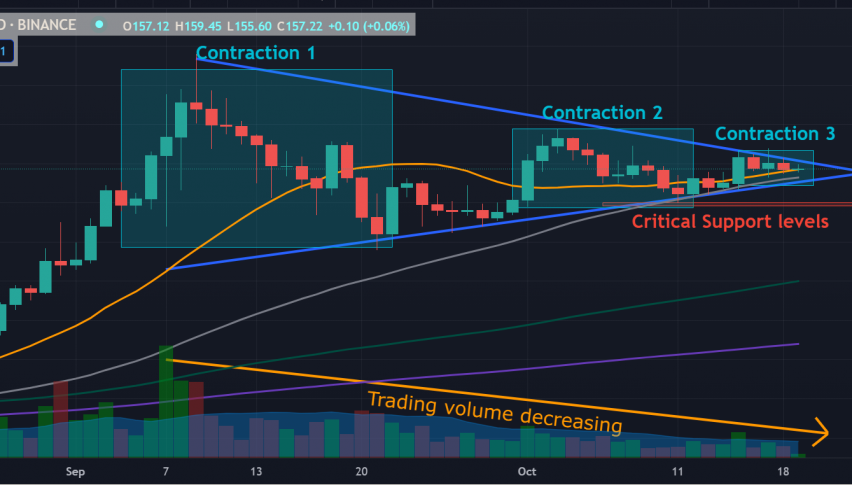
- Controlled Correction. After the explosive rally from July to September, SOL has pulled-back and consolidated for about two months, trading in a range from 220 to 120. It has never fallen below the critical psychological support of 100.
- Contracting Volatility. Each contraction has shown decreased volatility and trading volume. As seen in the chart above, a total of three contractions have happened since it reached its all-time high. The contractions are getting smaller and smaller each time.
- Selling Supply Slow-down. Aside from the contractions getting smaller, SOL’s trading volume during the same period has slowed down incrementally as well. This could be interpreted like this: the SOL bears may have stopped selling, as there is a lower supply coming into the market.

- Moving Averages Aligned. On the technical side, short and long-term moving averages have now aligned. This means that the 20-day MA (yellow) is above the 50-day MA (gray), and the 50-day MA is above the 100-day MA (green), and the 100-day MA is above the 200-day MA (purple). This indicates that SOL is on a definite uptrend in all timespans, be it long-term, short-term or mid-term. In most cases, this alignment of moving averages, if sustained, is a common precursor to a strong breakout rally.
All these factors contribute to a common bullish theme for Solana. As such, I reiterate a strong buy rating for SOL, as soon as it breaks out of its current consolidation. Of course, nothing is 100% sure, but at this point, it is do-or-die. A fall below the 50-day moving average or a breakdown below 140 could mean the end of the uptrend for SOL. However, a breakout above 160-170 could mean the start of another leg higher for the coin.
Trade Idea: Buy the Breakout
Buy: 160 – 170
(buy in tranches near this area: 160-170, watch volume – it has to be higher than normal)
Stop Loss: 140
(careful if it closes below the 50-day moving average, possible breakdown to 100-120 levels)
Targets:
Short-term: 180
Mid-term: 200-216 (all-time highs)
VAR: 1.00 (risk only 1% of your portfolio)
RRR: 2.00-2.80
- Check out our free forex signals
- Follow the top economic events on FX Leaders economic calendar
- Trade better, discover more Forex Trading Strategies
- Open a FREE Trading Account


