Fantom Price Analysis: Bullish Bias to Dominate Over $2.50 in FTM/USD
Fantom (FTM) broke out to a new all-time high, but the bulls could not sustain the breakout. The day's candlestick has a long wick...
The FTM/USD closed at $2.8655, after posting a high of $2.8945, and a low of $2.5662. The FTM/USD broke its 4-day bearish streak and its momentum turned bullish on Sunday. The proof-of-stake network’s FTM token recovered from the recent price correction that started this week. Its price rebounded by about 13% at the end of this week, and it reached its all-time high at $3.47 last week, but after that, it reversed, dropping to $2.65.
It looks like the price met with resistance, as the FTM experienced heavy selling pressure amid profit-taking. Investors were following the correction trend and exiting the market to book profits, which drove the FTM prices lower on most days of the week. But on Sunday, the crypto coin found support again, and started recovering its losses as the correction ended.
Fantom Live Rate
On the other hand, the crypto-coin FTM also ignored the strength of the US dollar and kept on rising over the weekend. The US Dollar Index surged all the way up to 94.30 on Friday, as investor expectations about rising interest rates increased in the market.
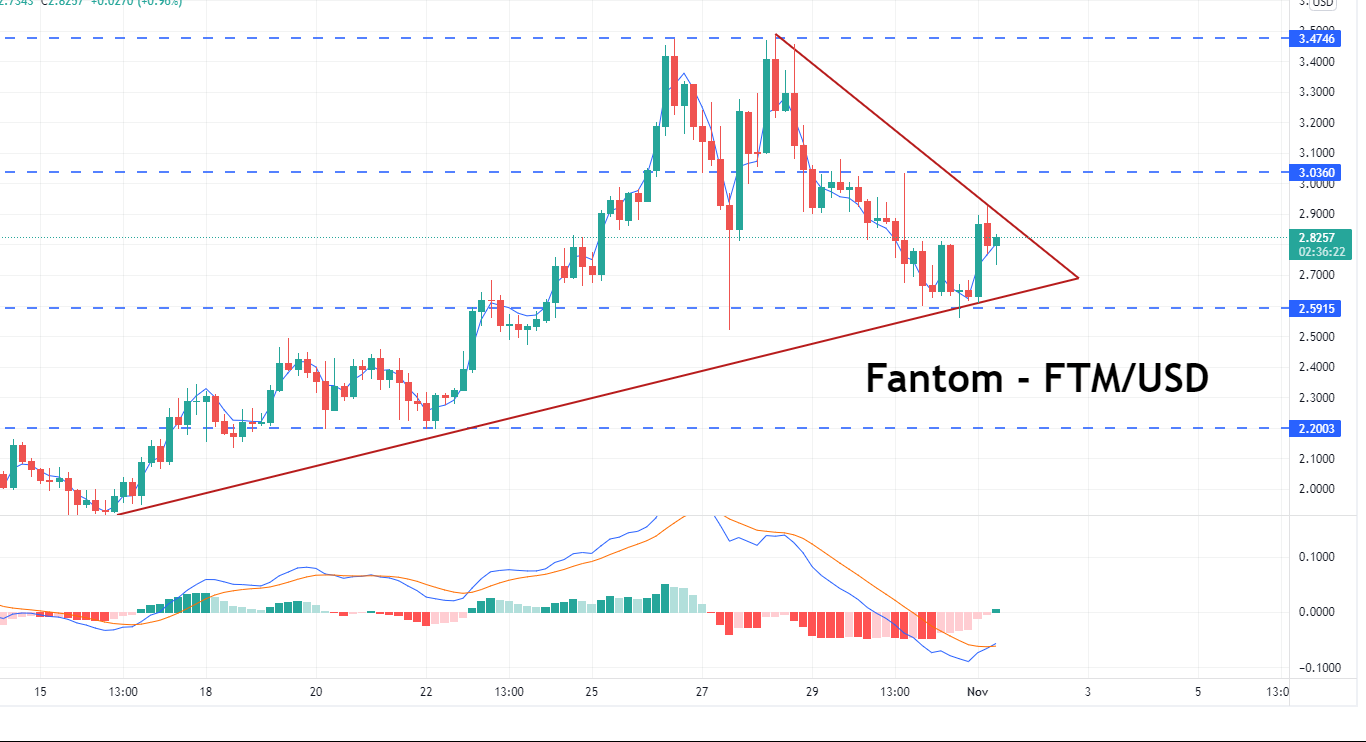
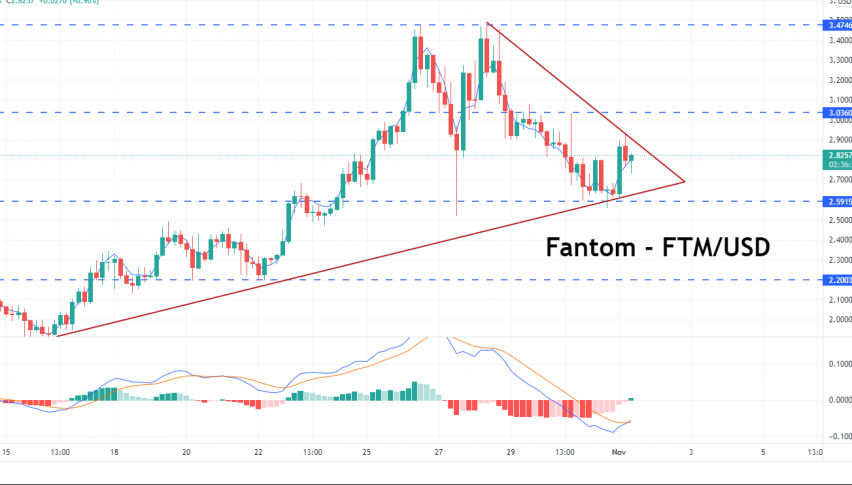
FTM/USD Price Analysis – FTM to Gain Support at $2.60
Fantom (FTM) broke out to a new all-time high, but the bulls could not sustain the breakout. The candlestick for the day has a long wick, indicating that traders took profits at higher levels. Bulls typically buy dips to the 20-day EMA ($2.52) during an uptrend. If the price rebounds from its current level, it indicates that the sentiment is still strong and traders are buying on dips. The bulls will then try to push the price above the $3.48 overhead resistance level.
If they are successful, the FTM/USD pair could resume its uptrend, with the next target being $4.10, followed by a move to the psychological threshold of $5. Contrary to popular belief, a breach below the 20-day EMA indicates that traders continue to liquidate their positions. The pair could then fall to the 50-day simple moving average ($1.86). The RSI’s negative divergence signals that the bullish momentum may be fading.
Daily Technical Levels
Support Resistance
2.6563 2.9846
2.4471 3.1037
2.3280 3.3129
Pivot Point: 2.7754
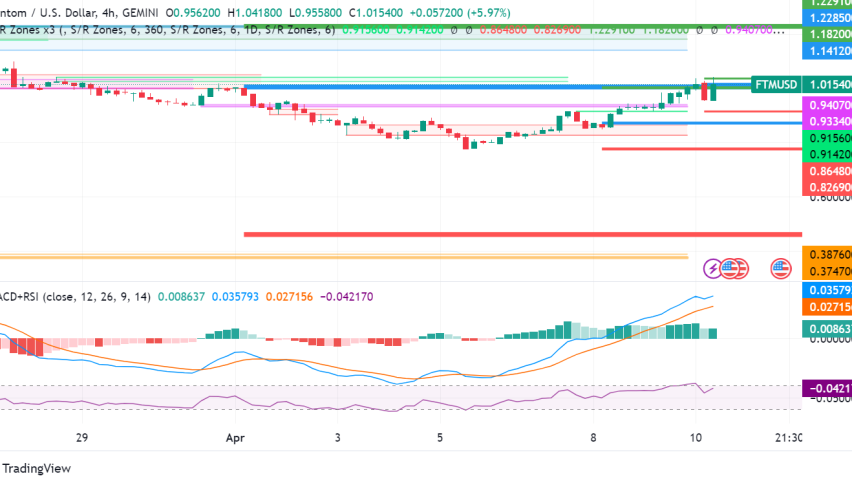
On the 4-hour chart, the moving averages have completed a bearish crossover, and the RSI has slipped into the negative zone, indicating that the bears have the upper hand. The previous breakout level at $2.45 is the first support level on the downside.
A strong rebound from this level indicates that the bulls are aiming to convert this level to support. If this occurs, the pair may attempt to advance to $3 and then to $3.48. If the price falls below $2.45, this bullish perspective will be rendered null and void.
- Check out our free forex signals
- Follow the top economic events on FX Leaders economic calendar
- Trade better, discover more Forex Trading Strategies
- Open a FREE Trading Account
- Read our latest reviews on: Avatrade, Exness, HFM and XM
Related Articles

Sidebar rates
Related Posts
