Litecoin Price Looking Up After LTC Bounces Off $200, Bitcoin BTC Fails at $60,000
Litecoin facing the 20 daily SMA as it reverses up, Bitcoin failing at $60,000
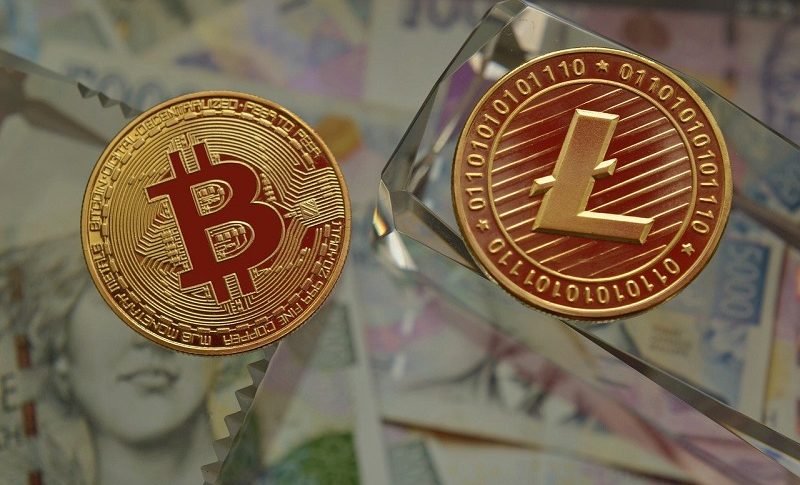
Cryptocurrencies went through a bearish period last week, posting some considerable losses, after some strong bearish momentum in the previous week. The retreat lower started as traders were booking profit on their buy positions lower, but eventually, the decline picked up pace as China pledged to keep up the crypto crackdown and the US Congress is planning to “regulate” cryptos and tax them eventually, as they include them on the infrastructure bill.
Although there will be some tax provisions for certain cryptocurrencies, the market hasn’t taken this news too well. The decline stalled last week and cryptos started to bounce higher, including Bitcoin and Litecoin, but they’re not exactly surging, so let’s see how LTC and BTC are doing, since we decided to open two buy signals here.
Litecoin Daily Chart Analysis – The 200 SMA Turning into Resistance

LTC/USD Revesring higher at $200
Litecoin was trading in a tight range for a few months, below the 200 SMA (purple) on the daily chart, until it made a decisive move about two weeks ago. The price surged from $200 up to $300 almost, in a quick move which lasted a few days. The partnership with Visa for the Litecoin Visa debit card, the announcement from AMC cinemas that they would accept Litecoin for payments, as well as the announcement of OmniLite which is a decentralized token creation platform, for the creation of stablecoins led to better sentiment.
This will lead to further adoption of Litecoin and the number of transactions increased to around 150k, which helped Litecoin surge higher. But, the fact that cryptos have been included on the infrastructure bill has weighed on Litecoin, which retreated down to $200 last week.
Litecoin Live Chart
Although, we saw a bounce off that round level last Thursday and LTC/USD bounced to $230, where buyers bet the 200 daily SMA (gray) which seems to have turned into some form of resistance. The trading volume has gone down in the last week or so, which has contributed to the decline, but the future looks bright and SaxoBank added Litecoin among 9 cryptos to the trading view platform, which is positive news. So, we are holding on to our buy LTC/USD signal, waiting for the bullish trend to resume again.
Bitcoin Daily Chart Analysis – $60,000 Turning Into Resistance

The $60,000 target turning into resistance for Bitcoin
Bitcoin made a decisive move in October, as it turned bullish and moved above the previous resistance at $65,000. The uptrend picked up again in November and we saw some new all-time highs, close to $70,000. But the retreat sent the price back below $60,000 for BTC during this bearish period.
Although, the main trend is quite bullish for BTC/USD and this bearish period might be approaching the end soon, hence our buy Bitcoin signal. Bitcoin tried to resume the bullish trend late last week, but buyers failed to push above $60,000. We still think that Bitcoin is heading for $100K in a few months, so we’re holding to this signal too. On a side note, EL Salvador is planning to build a Bitcoin city near a volcano, which will be powered by the volcano itself and $1 billion in cash will be raised via a Bitcoin bond.
Bitcoin Live Chart
- Check out our free forex signals
- Follow the top economic events on FX Leaders economic calendar
- Trade better, discover more Forex Trading Strategies
- Open a FREE Trading Account
- Read our latest reviews on: Avatrade, Exness, HFM and XM
Related Articles
Sidebar rates
Related Posts
