Gold Price Analysis: Weaker US Existing Home Sales Push XAU/USD to $1,815
Gold prices were closed at $1804.35 after setting a high of $1806.20 and a low of $1785.80. Gold reversed its course on Wednesday after
- Existing home sales declined to 6.46 million against the predicted 6.55 million and weighed one dollar
- The slight decline in the US Treasury Yields and the ongoing decline in US dollar prompted renewed buying interest in bullion.
- The final GDP for the quarter surged to 2.3% against the projected 2.1% and supported the US dollar.
Gold Rate Live
The US Dollar Index, which measures the greenback’s value against a basket of six major currencies, fell for the third consecutive session and dropped to 96.02. At the same time, the US Treasury yield on the benchmark 10-year note found it hard to extend its gains and hovered around 1.45%.The slight decline in the US Treasury Yields and the ongoing decline in US dollar prices prompted renewed buying interest in bullion. Furthermore, gold was also high because of the prevailing concerns related to the Omicron variant. The fears of the new variant and its spread raised the risks of increased inflation and the chances for clearer monetary policy from the Federal Reserve, which pushed gold higher on Wednesday.
On the data front, at 18.30 GMT, the final GDP for the quarter surged to 2.3% against the projected 2.1% and supported the US dollar. The final GDP price index for the quarter remained flat at 6.0%. At 20:00 GMT, the CB Consumer Confidence from the US in December advanced to 115.8 against the anticipated 111.1, which supported the US dollar. Existing home sales declined to 6.46 million against the predicted 6.55 million and weighed one dollar. Most of the data from the US was in favor of the dollar, which ultimately limited the rising prices of precious metals on Wednesday.
Despite favorable economic data, the US dollar remained under pressure on Wednesday amid renewed risk appetite driven by an encouraging Omicron study and increased optimism surrounding the global economic outlook. A study from South Africa revealed that the risks of hospitalization and severe disease in Omicron-infected people were less than in the previous variant Delta. Furthermore, on Wednesday, the United States authorized Pfizer’s anti-viral COVID-19 pill named Paxlovid to be used for people aged 12 and above and for people at severe risks. This optimism rekindled risk appetite, dragging the US dollar lower due to its safe-haven status while driving gold higher, as the two have a negative correlation.
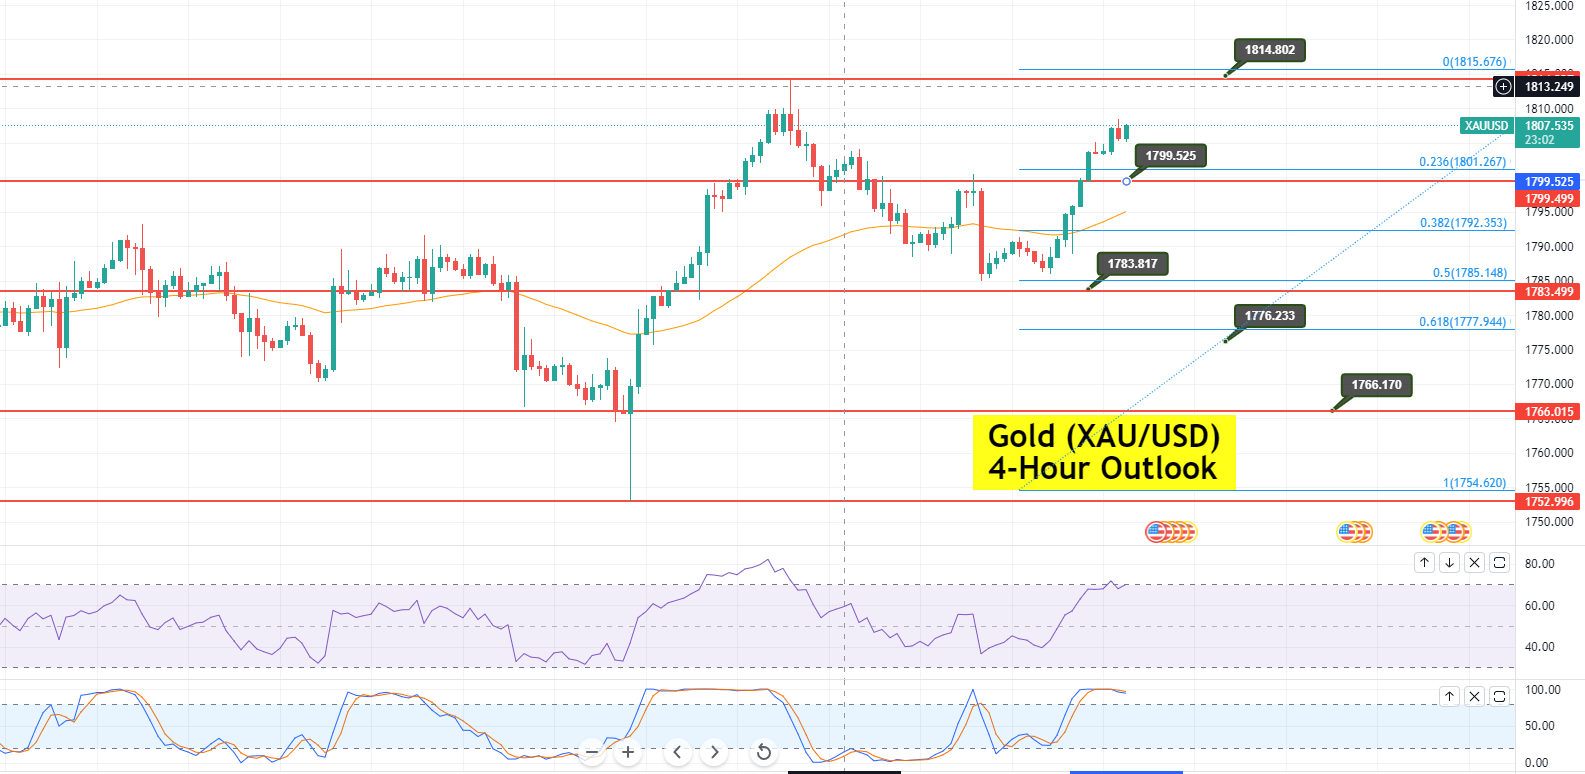
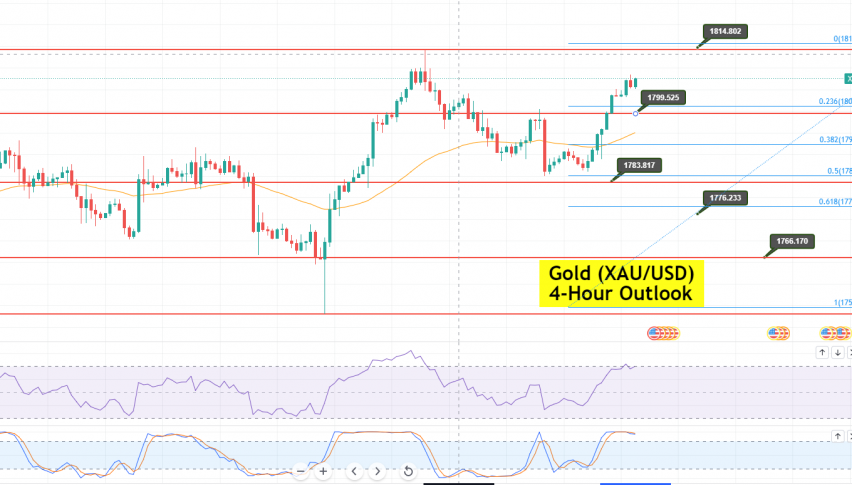
Daily Technical Levels
Gold (XAU/USD) – A technical outlook; bullish bias dominates
- Check out our free forex signals
- Follow the top economic events on FX Leaders economic calendar
- Trade better, discover more Forex Trading Strategies
- Open a FREE Trading Account