Solana SOL, Shiba Inu Facing Resistance Above as They Try to Reverse Higher
Shiba Inu coin and Solana have been on a bearish trend since November, losing more than two-thirds of their value from the all-time high they placed before the reversal. They are both interesting blockchains in their own way, having received a lot of interest in 2021, so it’s certain that they will resume the uptrend at some point, but they are facing resistance above, as they try to reverse higher.
Shiba Inu Daily Chart Analysis – Can SHIB Push Above the 100 SMA?
Shiba Inu token has been on a bearish trend for months, with retraces higher being pretty weak, apart from the surge early in February, as the sentiment in the crypto market improved while they were preparing to launch Shibarium. This Layer-2 blockchain will increase the transaction speed, since the Layer-1 networks are suffering from congestion, as Shiba prepares to launch Shiberese as well, which will put it into the GameFi scene.
SHIB/USD jumped from around $0.000020 to $0.000035, which means a 75% gain in a few days. But, it failed to push above the 100 SMA (green) on the daily chart, and Shiba started to reverse lower, as the sentiment in the crypto market turned bearish again. In the last two days though, the price has tried to turn bullish, as the sentiment improves somewhat, but for the trend to shift, buyers would have to take out the 100 SMA (green) above and then push above $0.000035, which was the last high.
Solana Daily Chart Analysis – The Last Support Above $80 Holds

Will this last support hold for Solana coin?
Solana attracted a lot of attention last year, with many applications being built on its blockchain. Last month Solana also announced the launch of Solana Pay, which is a decentralized payments protocol for merchants and e-commerce platforms. This will make paying with Solana digital assets a lot easier, and it has already been integrated into the crypto exchange, FTX, and the crypto wallets, Phantom and Slope.
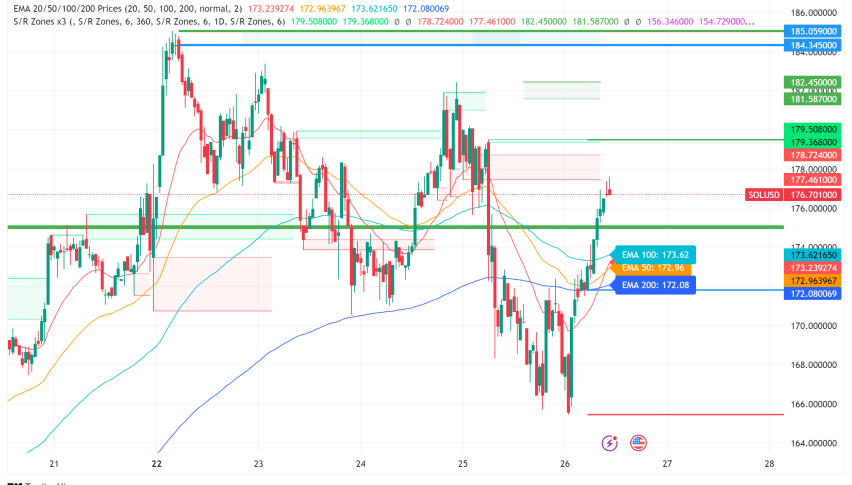
Last month, as the sentiment improved, SOL/USD did bounce off the support zone, which stands above $80, but it reversed back down. It pierced the support level and pushed below $80 this time, but there was no close below that area, so the support zone holds. Now the price is starting to bounce higher, but there are many support/resistance levels to be broken after the 50 daily SMA (yellow), which stands just above it.


