Ethereum Violates Symmetrical Triangle – Why $2,600 Could Drive Downtrend
Ethereum has continued to fall below the $2,600 support level against the US dollar. The price of ETH may even retest $2,445, where the
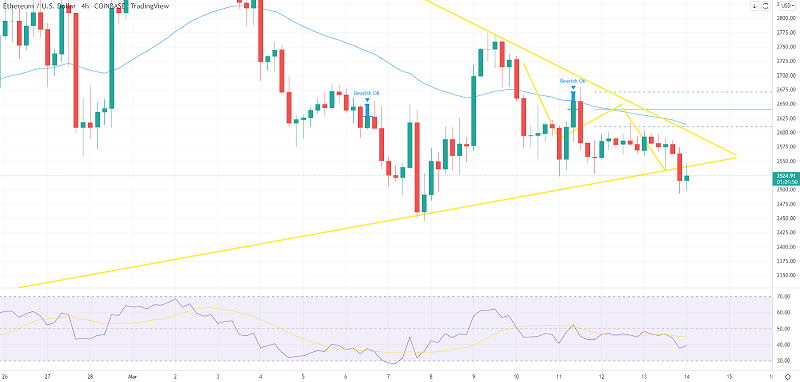
Ethereum has continued to fall below the $2,600 support level against the US dollar. The price of ETH may even retest $2,445, where the bulls may appear. Ethereum remained bearish below the $2,650 support level. The price is currently trading below $2,600 and the 100 hourly (SMA) simple moving average.
On the hourly timeframe of ETH/USD, a critical bearish trend line is forming with resistance near $2,600. If the pair fails to hold above $2,500 and $2,445, it may continue to fall. The Ethereum price has turned red.
From well above $2,700, Ethereum began a new decline. ETH/USD plunged under the $2,650 and $2,600 support marks, entering the red zone.
A formation of candles below the $2,600 mark was also recorded, close below the 100-day SMA. The price of Ethereum has dropped to as low as $2,525 and is currently consolidating losses. On the upside, there is immediate resistance near $2,585. It is close to the 23.6 percent Fib retracement level of the recent drop from the $2,775 swing high to the $2,525 low.
The first significant resistance is seen near $2,620 and the 100 hourly simple moving average. On the hourly timeframe of ETH/USD, a key bearish trend line is forming with resistance near $2,600.
The next major stumbling block is located near $2,650. It is close to the 50% Fib retracement level of the recent drop from the $2,775 swing high to the $2,525 low. A close above the $2,650 resistance level could signal the start of a steady rise. In the aforementioned scenario, the price may rise to the $2,750 level, where the bears may take a stand in the near term.
More ETH Losses?
If Ethereum does not begin a new upward trend above $2,620, it may continue to fall. On the downside, the $2,525 level provides initial support.
The next significant support is around $2,500. A close below the $2,525 and $2,500 support levels may cause the price to fall even further. In the aforementioned scenario, the price could rise to $2,445. Any further gains may pave the way for a more significant drop towards the $2,320 or even $2,250 level.
- Check out our free forex signals
- Follow the top economic events on FX Leaders economic calendar
- Trade better, discover more Forex Trading Strategies
- Open a FREE Trading Account