Ethereum Steady Under $3050 – Why Double Top is Crucial for Buyers
Ethereum attempted to maintain a steady rise above $3,000 against the US dollar. The price of ETH fell below $3,050 and began a downward
Ethereum attempted to maintain a steady rise above $3,000 against the US dollar. The price of ETH fell below $3,050 and began a downward trend. After failing to break through $3,050, ETHEREUM began a downward trend. The price is currently trading above $2,900 and the 100 hourly simple moving average.
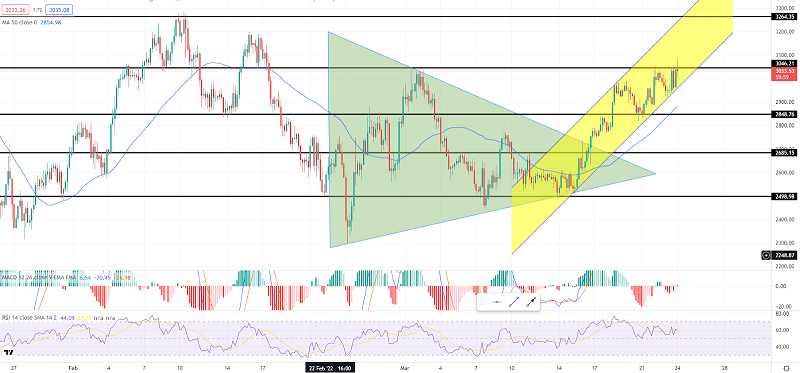
On the hourly timeframe of ETH/USD, a major contracting triangle is forming with resistance near $2,965. The pair is consolidating above $2,900 and may begin to rise again in the near term.
Ethereum’s Price Remains Stable
Ethereum has begun a steady rise above the $2,850 resistance level. ETH broke through the $2,920 and $2,950 resistance levels to move further into the green. The price even accelerated above $3,000 and settled above the 100 hourly simple moving average. A high near $3,054 was formed, and the price is now correcting gains. As a result, it retraced a few points below the $3,000 level.
The price plunged under the 50 percent Fib retracement mark of the upward move from the swing low of $2,885 to the high of $3,054. It is now trading above the $2,900 mark and the 100 hourly SMA.
On the hourly timeframe of ETH/USD, a major contracting triangle is forming with resistance near $2,965. The triangle support is near the 76.4 percent Fib retracement level of the upward move from the swing low of $2,885 to the high of $3,054.
If the price rises again, it may break through the $2,965 and $2,980 resistance levels. The major resistance is located near the $3,000 level. To begin another uptrend, the price of ether must break through the $3,000 resistance level. In the scenario above, the price could rise to $3,050. Any further gains may necessitate a move towards the $3,120 resistance level in the coming sessions.
Is There a Downturn in ETH?
If Ethereum fails to break through the $3,000 barrier, it may begin a downward trend. On the lower side, initial support is near the trend line support and $2,940.
The next significant support is near $2,925 and the 100 hourly SMA. A break below the $2,925 support level could lower the price. In the scenario above, the price could fall to $2,850.
- Check out our free forex signals
- Follow the top economic events on FX Leaders economic calendar
- Trade better, discover more Forex Trading Strategies
- Open a FREE Trading Account
- Read our latest reviews on: Avatrade, Exness, HFM and XM
Related Articles


Sidebar rates
Related Posts
