Dogecoin Retests $0.076 – What Could Drive Further Dip in DOGE/USD?
Over the last week, the price of Dogecoin has been rising. The coin gained double digits in the previous seven days, rising by nearly 20%.
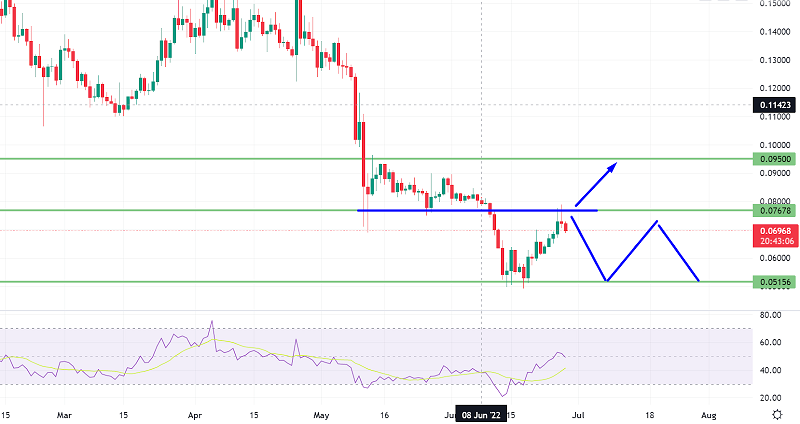
Over the last week, the price of Dogecoin has been rising. The coin gained double digits in the previous seven days, rising by nearly 20%. The meme-coin has encountered stiff resistance at the $0.07 level, and if it trades near that level, it could drop to its next support line of $0.05.
The bulls have attempted to show signs of improvement as the coin has slowly moved upwards over the last few days. However, DOGE/USD has lost some market value in a shorter time frame. Dogecoin has dropped by 4% in the last 24 hours.
The coin’s technical outlook has also shown some bullishness, with the coin rising by nearly 20%. Buying strength has also recovered in the last week, but because the meme-coin has shown some bearishness in the shorter time frame, sellers are currently outnumbering buyers.
Even though the four-hour chart of DOGE shows negative price movement, the coin has shown a bullish reversal pattern. The global cryptocurrency market cap is currently $979 billion, down 2.9% in the last 24 hours.
Dogecoin Technical Outlook
On the one-hour chart, DOGE was trading at $0.072. The coin has been trapped at the same resistance level for several weeks. A drop from the current price level will take Dogecoin to $0.060, failing which the coin will try to trade at $0.047. The coin’s overhead resistance was $0.08, then $0.09. The coin has established a bullish reversal pattern on a longer time horizon.
The pattern is known as the BARR Bottom; a bump-and-run reversal bottom pattern is what the BARR Bottom pattern is. This technical pattern is associated with a long-term trend reversal in a bear market. The pattern is divided into three phases: the Lead-In phase, the Bump phase, and the Run phase.
Dogecoin is currently in the bump phase, followed by the run phase, which will reverse the bearish price action. If this occurs, the coin could reach $0.090 and then $0.011. However, the volume of Dogecoin traded has decreased, indicating that the buying strength has decreased on the chart.
- Check out our free forex signals
- Follow the top economic events on FX Leaders economic calendar
- Trade better, discover more Forex Trading Strategies
- Open a FREE Trading Account
- Read our latest reviews on: Avatrade, Exness, HFM and XM
Related Articles


Sidebar rates
Related Posts
