Bitcoin Steady Below $24K – Why Could BTC Initiate Bearish Correction?
Bitcoin gained momentum and broke through the $24,000 resistance level against the US dollar. If BTC remains above the $23,000 support
Bitcoin gained momentum and broke through the $24,000 resistance level against the US dollar. If BTC remains above the $23,000 support, it could rise even further towards $25,000.
BITCOIN remained in the green and rose above the $24,000 resistance level. The price is now trading above $23,000 and approaching the 100 hourly simple moving average.
On the hourly chart of the BTC/USD pair, a key bullish trend line is forming with support near $23,200. If the pair breaks through the $23,750 and $24,000 levels, it could continue to rise.
Bitcoin Price is Still Rising
After breaking through the $23,000 resistance level, the Bitcoin price began to rise steadily, and BTC gained momentum as it approached the $23,500 resistance level.
Price broke through the $23,750 barrier and settled above the 100 hourly simple moving average. Finally, it surpassed the $24,000 mark. A high near $24,264 was formed, and the price is now consolidating gains. Below the $23,750 level, there was a minor downside correction.
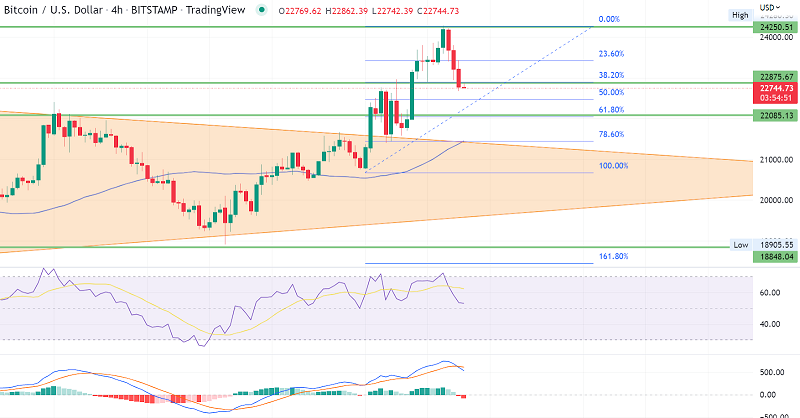
Bitcoin was trading below the 38.2 percent Fib retracement level of the upward move from the swing low of $21,405 to the high of $24,264. On the other hand, the bulls were active near the $23,000 support zone.
On the hourly chart of the BTC/USD pair, a key bullish trend line is forming with support near $23,200. On the plus side, the bitcoin price may encounter resistance near the $23,750 mark. The next significant resistance level is around $24,000.
A close above the $24,000 resistance level may set the tone for further gains. In the aforementioned case, the price could rise to $24,500. The next major barrier is located near the $25,000 mark.
Dips Accepted in BTC?
If Bitcoin fails to break through the $23,750 resistance level, it may begin a downward trend. On the downside, there is immediate support near the $23,200 level. The next significant support is located near the $23,000 level and the trend line zone.
It is also close to the 50% Fib retracement level of the upward move from the swing low of $21,405 to the high of $24,264. A clear break below the trend line support could decrease the price to $22,250 and the 100 hourly simple moving average. Good luck!
- Check out our free forex signals
- Follow the top economic events on FX Leaders economic calendar
- Trade better, discover more Forex Trading Strategies
- Open a FREE Trading Account
- Read our latest reviews on: Avatrade, Exness, HFM and XM
Related Articles


Sidebar rates
Related Posts
