Ethereum Gains Support at $1,500 – Is It Going for $1,750?
On the chart, Ethereum has fallen below its $1,600 support level, indicating a negative attitude. Ethereum's current price behavior is also
On the chart, Ethereum has fallen below its $1,600 support level, indicating a negative attitude. Ethereum’s current price behavior is also influenced by broader market weakness. For instance, BITCOIN had dropped to the $20,000 price level, and altcoins had followed suit.
On the chart, ETHEREUM has shown some slight appreciation in the recent 24 hours. However, the technical outlook for the altcoin has remained gloomy. Buying strength had declined over the previous two days, and sellers controlled the coin’s movement at the time of publication. However, continued selling pressure might push ETH to the $1,100 mark before it regains momentum.
If the bulls re-enter the market, ETH may continue consolidating on its chart before attempting to ascend. However, for Ethereum to disprove the bearish thesis, buying strength must also recover significantly. As a result, Ethereum has lost 4% of its market value in the last week.
At the moment, ETH was trading at $1472. After a dramatic drop, Ethereum attempted a modest recovery, but bearish pressure remained strong in the market. The altcoin’s overhead resistance was $1,542, and the recent price drop will push ETH down to $1,260.
To refute the bearish argument, Ethereum must trade over $1,600 for more than a few trading sessions. If buying strength does not show consistency, Ethereum might tumble to $1,100 in a few days.
The volume of ETH traded in the previous session increased, indicating that purchasing strength was struggling to advance north on the chart. Although the technical prognosis for the altcoin was bearish, buying strength attempted to revive in the previous 24 hours.
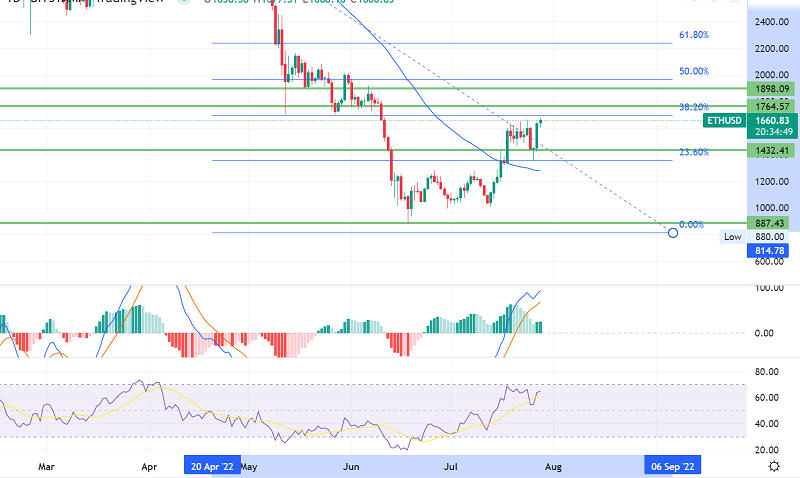
Ethereum (ETH/USD) Technical Outlook
The Relative Strength Index was below the half-line but has risen in recent trading sessions. On the four-hour chart, this meant that buying strength was regaining. Despite the recovery, the altcoin’s price was below the 20-SMA line.
A reading below the 20-SMA line indicates that sellers are driving the market’s price momentum. Let’s keep an eye on the 1,500 level as the ETH/USD may trade bullish above this level. Good luck!
- Check out our free forex signals
- Follow the top economic events on FX Leaders economic calendar
- Trade better, discover more Forex Trading Strategies
- Open a FREE Trading Account