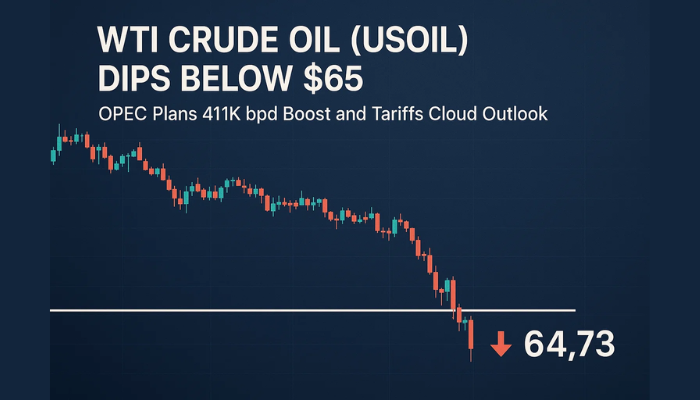
Crude Oil Making the Big Break As Inventories Increase and Demand Falls
Crude Oil failed to hold the gains during retraces higher and it has turned bearish again, falling below $90

The situation for crude Oil is getting worse as the highs keep getting lower, while yesterday we saw a break of the 200 SMA (purple) on the daily chart, which had been acting as support since July 14. We have seen a tough fight from buyers below $100 and several attempts to turn the price bullish, but they kept failing and yesterday the wedge was broken to the downside.
We saw a jump above $96 in the US WTI crude after the decision from OPEC to raise production by only 100k barrels per day, which is only a small amount, so one of the risks was removed. But, the jump in the US ISM services pushed the USD higher and crude Oil back down.
WTI Crude Oil Daily Chart – The 200 SMA Breaks
 US crude Oil breaks the wedge to the downside
Then came the US crude inventory data which showed a big buildup of 4.5 million, while official expectations were for a drawdown of -1.4 million. This wasn’t as big a surprise as it should have been because of the private API report released yesterday, which contradicted the official expectations.
Weekly US Oil Inventory Data
- Weekly crude Oil inventories +4,467K vs -629K expected
- Previous week was -4,523K
- Gasoline +163K vs -1,614K exp
- Distillates -2,400K vs +1,038K exp
- Refinery utilization -1.2% vs +0.6% exp
- US implied oil demand (product supplied) fell by 28kbpd w/w to 19.948mbpd last week with gasoline down 704k bpd.
Oil prices continued sliding lower after the US inventories report, reaching July’s low of $90.40 and we saw a slight retreat higher from that support area.
API data released late yesterday:
- Crude +2165K
- Gasoline -204K
- Distillates -351K
- Cushing +653K
The jump in oil after OPEC has been erased. The fall in gasoline implied demand is a bit puzzling given falling prices and reports of higher demand at the pumps but the numbers are what they are.
US WTI Crude Oil Live Chart
- Check out our free forex signals
- Follow the top economic events on FX Leaders economic calendar
- Trade better, discover more Forex Trading Strategies
- Open a FREE Trading Account
 US crude Oil breaks the wedge to the downside

