Preparing to Sell Crude Oil, With the Bullish Retrace Nearly Complete
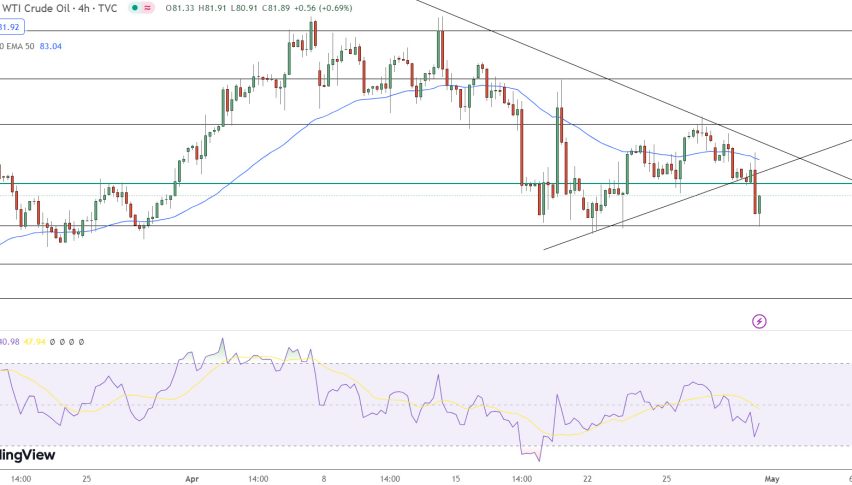
Crude Oil has been bearish since the middle of June, as the global economy was heading into a recession, with prices surging and central banks hiking interest rates pretty fast. Back then US WTI crude was trading above $123, while last week it fell to $80 lows, as the bearish momentum escalated on a stronger USD.
But, crude Oil markets reversed on Thursday and have made some decent gains since then, after declining by almost a third since June with geopolitics continuing to cause volatility and influence prices. The weakness in the USD has been a factor, while a proposed price cap on Russian Oil and gas imports by the EU has been influencing crude prices in recent days, adding support to the price.
But today there were comments that the EU is unlikely to cap the price of Russian gas. There were reports over the weekend that the EU was split on the decision to cap Russian gas prices as countries were unable to strike a compromise on the details. Now, the latest report is that the EU is set to retreat from imposing said price cap but will push ahead with windfall taxes on energy companies’ surplus profits.
Just a heads up that EU president von der Leyen is expected to publish the bloc’s plan on this matter tomorrow. There is still time for things to change between now and then but for now, it looks like there is still no coming together on putting a price cap on Russian gas at least.
Crude Oil Daily Chart – Will the 20 SMA Stop the Climb?

The main trend is still bearish on Oil
Crude Oil has gained around 8 cents since then, pushing above the previous low, but now buyers are facing the 20 SMA (gray) on the daily chart) which used to act as support during the uptrend and now it has turned into resistance. Above that is the 50 SMA (yellow) and then the 200 SMA (purple), so we are looking to open a long-term sell signal soon.


