Bitcoin Choppy Session Continues – Quick Technical Outlook Today
Bitcoin began an upward retracement against the US dollar at $18,150. BTC is back above $19,200, and a breakthrough above $19,500 could
Bitcoin began an upward retracement against the US dollar at $18,150. BTC is back above $19,200, and a breakthrough above $19,500 could trigger a new rise. BITCOIN is exhibiting some signs of life above the $19,000 mark. The price is currently trading over $19,000 as well as the 100 hourly simple moving average.
On the hourly timeframe of the BTC/USD pair, a significant contracting triangle is building with support near $19,200. If there is a convincing move above the $19,500 resistance zone, the pair might spark a new surge.
Bitcoin is on a Bullish Run
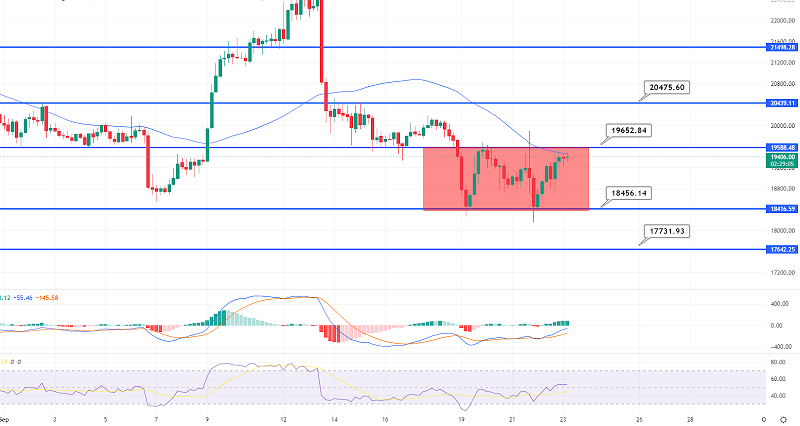
The Bitcoin price maintained well above the $18,150 mark. BTC fell as low as $18,138 before beginning a good comeback wave. The price was able to rebound above the barrier levels of $18,800 and $19,000.
There was a rise over the 50% Fib retracement line of the negative move from the swing high of $19,888 to the low of $18,138. The bulls even managed to drive the price past the $19,200 resistance level. It is presently trading above the $19,000 mark as well as the 100 hourly simple moving average.
On the hourly chart of the BTC/USD pair, a significant contracting triangle is building with support near $19,200. Bitcoin’s price is beginning to rise past the $19,000 mark.
On the upside, the $19,475 level represents an immediate barrier. It is close to the 76.4% Fib retracement level of the decline from the $19,888 swing high to the $18,138 low. The next significant resistance level is $19,680.
A close above $19,680 might spark a new rush to $20,000. Any further advances might push the price up to the $20,500 resistance level.
What If the Bitcoin Price Drops?
If the BTC/USD fails to rebound above the $19,680 level, it may begin a new drop. The triangular lower trend line and the $19,200 zone provide immediate downward support.
The next significant support is approaching $19,000 and the 100 hourly SMA. A decisive fall below $19,000 might set the stage for a new slump. In the above mentioned case, the price may possibly reach $18,500.
- Check out our free forex signals
- Follow the top economic events on FX Leaders economic calendar
- Trade better, discover more Forex Trading Strategies
- Open a FREE Trading Account
- Read our latest reviews on: Avatrade, Exness, HFM and XM
Related Articles


Sidebar rates
Related Posts
